If you are serious about personal finance, you likely view your net worth as more than just a vanity metric. It is the ultimate financial scorecard, the single most accurate indicator of your long-term financial health. While income tells you how much is coming in, and a budget tells you where it is going, your net worth tells you what remains. It is the accumulation of your financial decisions over time.
However, tracking this number effectively is often harder than it should be. Most people find themselves stuck between two imperfect options. On one side, you have automated apps like Mint or Monarch. These are convenient because they sync with your banks, but they are rigid; you cannot customize the reports, adjust the forecasting logic, or dig into the raw data. On the other side, you have the traditional spreadsheet. This offers infinite flexibility, but it requires a tedious ritual of logging into five different banking portals every month to copy and paste balances.
There is a better way to handle this workflow. By using Quadratic, a modern spreadsheet that integrates with Python and live data sources, you can achieve true spreadsheet automation, building a hybrid solution. This approach gives you the customizability of a net worth spreadsheet combined with the automation of a SaaS tool. It turns a static snapshot into a living dashboard that helps you not only track your wealth but understand the drivers behind it.
Back to basics: how is net worth calculated?
Before diving into automation and analysis, it is helpful to establish the fundamental formula. If you are researching how to calculate net worth, the equation is deceptively simple:
Assets – Liabilities = Net Worth
To get an accurate number, you must correctly define and capture all variables in this equation.
Assets include everything you own that has monetary value. This typically encompasses:
- Liquid cash (checking and savings accounts).
- Investment accounts (brokerage, 401k, IRAs).
- Real estate (primary residence, rental properties).
- Physical assets (vehicles, jewelry, collectibles).
Liabilities include everything you owe to others. Common examples are:
- Credit card balances.
- Student loans.
- Mortgages.
- Auto loans.
- Personal debts.
Understanding how is net worth calculated is the first step in moving from living paycheck-to-paycheck to intentionally building wealth. When you calculate your net worth regularly, you stop focusing solely on monthly cash flow and start focusing on equity and asset growth.
The problem with standard net worth trackers
Despite the simplicity of the formula, maintaining an accurate view of your finances is difficult because the tools often fail the user.
The most common pitfall is the static spreadsheet trap. You might download a free template, spend hours setting it up, and feel great about your financial clarity. But three months later, you realize you haven't updated it because the manual entry is too time-consuming. A manual net worth tracker is only useful if you have the discipline to update it constantly. For many, the friction of logging into multiple accounts kills consistency.
Alternatively, users turn to "black box" apps. These apps give you a number, but they often obscure the details. They might miscategorize a transfer as an expense or refuse to let you model a specific future scenario. You are trading control for convenience.
The gap in the market is clear: sophisticated users need a tool that updates itself automatically like an app but allows for deep, custom analysis like a spreadsheet.
Building a "living" calculator in Quadratic
Quadratic bridges this gap by allowing you to connect directly to financial institutions via Plaid while retaining the familiar grid interface of a spreadsheet. Here is how you can set up a system that works for you.
Step 1: Automated syncing
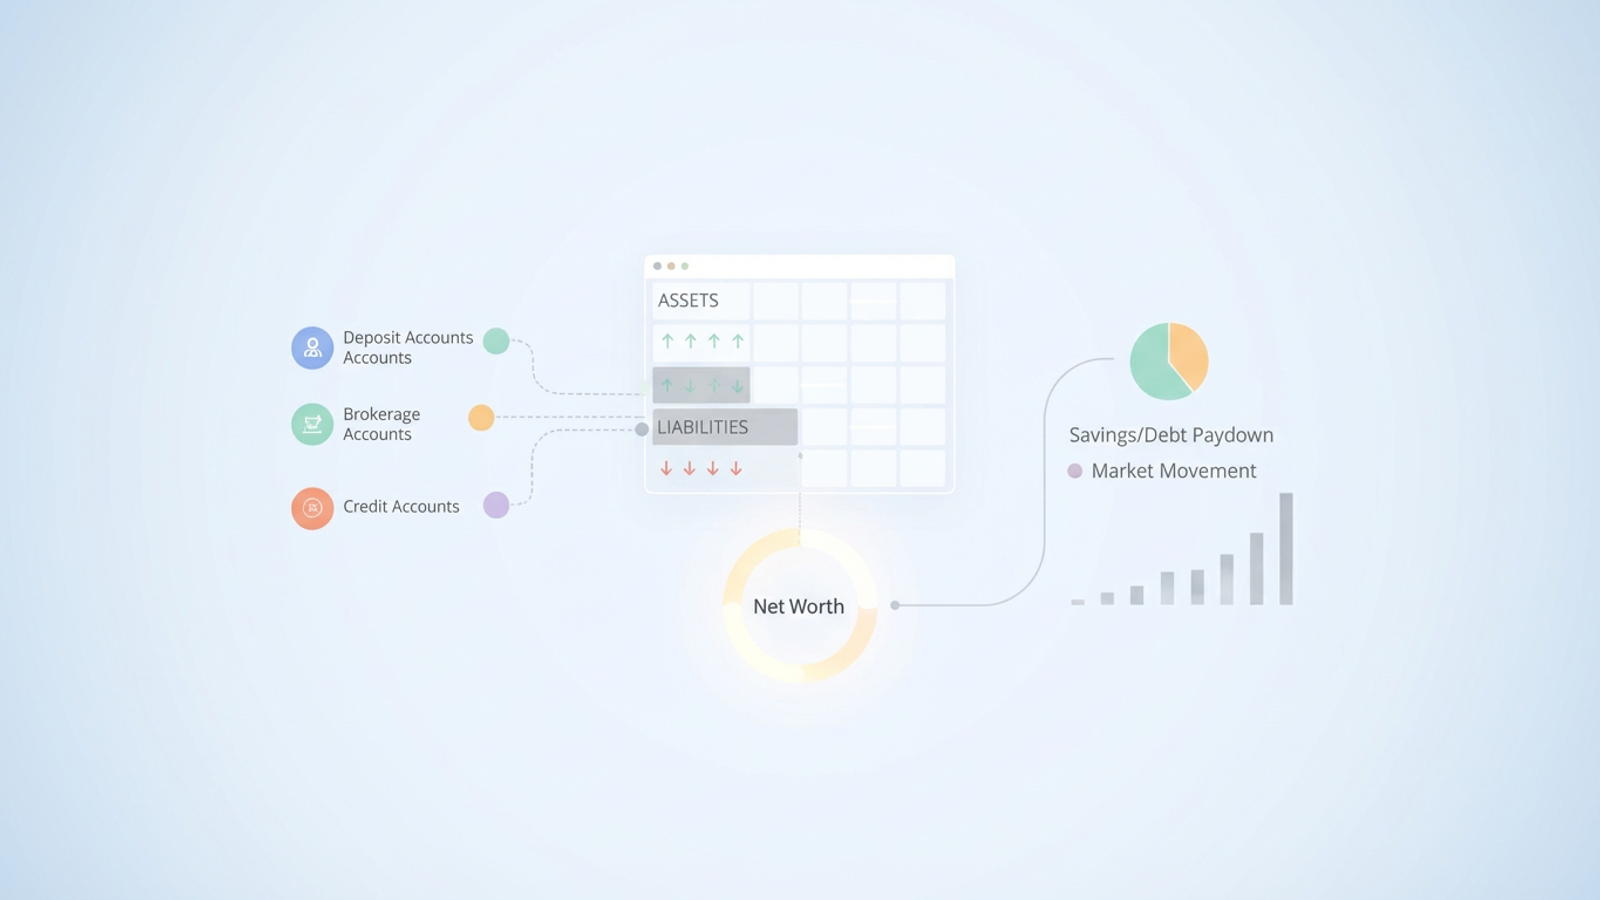
The foundation of a living calculator is live data. In Quadratic, you can connect your deposit, brokerage, loan, and credit accounts directly through Plaid integrations. Instead of logging into your bank’s portal to check a balance, the data flows directly into your spreadsheet. This eliminates the primary point of friction—data entry—and ensures that every time you open your sheet, the numbers are current.
Step 2: Organizing the data
Once the data is flowing into the grid, you can organize it into your two primary categories: Assets and Liabilities. Because you are in a spreadsheet environment, you have full control over how this data is grouped. You might want to group all retirement accounts together to see your "accessible vs. inaccessible" cash, or perhaps you want to group liabilities by interest rate to prioritize paydowns.
Step 3: The dashboard view
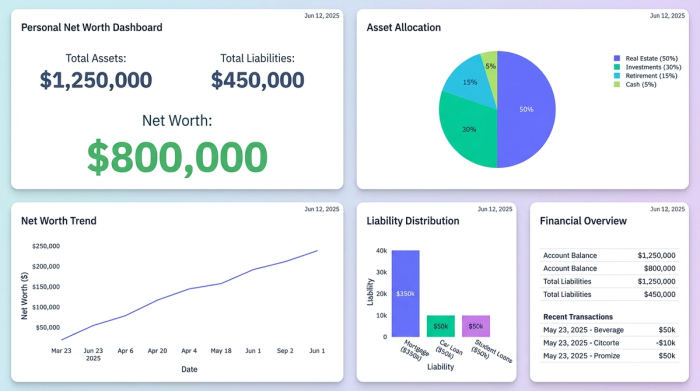
With your data streams active and categorized, you can create a summary view that executes the core formula: Total Assets minus Total Liabilities. In a standard spreadsheet, this number would be static until you manually changed a cell. In Quadratic, because the underlying data is connected to your accounts, your net worth figure updates automatically as your account balances change. You can calculate net worth in real-time without lifting a finger.
Beyond the snapshot: analyzing your wealth
The true power of a custom solution lies in analysis. Most apps provide a snapshot, telling you that your net worth is $5,000 higher than it was last month. While positive, this information is incomplete. To truly manage your finances, you need to understand why it changed. This is known as attribution analysis, or the decomposition of changes.
Tracking over time
You can set up your Quadratic sheet to log monthly snapshots automatically. By recording the state of your finances on the first of every month, you build a historical trend line that is far more granular than what most banking apps provide.
Attribution analysis
This is where the distinction between a simple tracker and a financial tool becomes clear. When your net worth increases, it generally happens for one of two reasons:
1. Savings/Debt Paydown: You spent less than you earned and saved the difference, or you paid down principal on a loan. This is a measure of your financial discipline.
2. Market Movement: Your investment portfolio increased in value due to market performance. This is a measure of market conditions (or luck).
In Quadratic, you can separate these variables. You can compare the change in your cash and loan balances against the change in your investment balances. This allows you to see if your net worth grew because you were disciplined with your budget, or simply because the S&P 500 rallied. Understanding this distinction is crucial; it prevents you from feeling wealthy solely due to a bull market and keeps you honest about your savings rate.
Benchmarking and future planning
Once you have a handle on your current position and historical performance, you can look forward.
Benchmarking
Many people search for a net worth percentile calculator to see how they stack up against their peers by age or income bracket. While benchmarking can be an interesting reality check, comparing yourself to others is often less useful than tracking your own velocity. The most important benchmark is your own previous month. Are you accelerating your wealth accumulation?
Forecasting with Python
Standard spreadsheets rely on complex, brittle formulas to forecast compound interest or retirement scenarios. Quadratic integrates Python directly into the grid, making these simulations much easier and more powerful.
You can write a simple Python script within your sheet to project your wealth ten or twenty years into the future. You can create variables for "Savings Rate," "Market Return," and "Inflation," and then run scenarios. For example, you can instantly calculate net worth projections based on increasing your savings rate by 5% versus achieving a 2% higher return on your investments. This turns your calculator into a strategic planning tool, helping you make decisions today that impact your financial freedom tomorrow.
From data entry to financial strategy
A net worth calculator should not be a chore that requires hours of data entry every month. It should be a strategic tool that informs your decision-making. By moving away from static templates and rigid apps, and moving toward a connected, flexible environment like Quadratic, you gain control over your financial narrative.
When you automate the data collection, you free up your time to focus on what matters: analyzing the trends, understanding the attribution of your growth, and planning for the future. Stop manually updating cells and start building a living financial dashboard today.
Use Quadratic to track your net worth
- Automate data collection: Connect directly to banks, brokerage, and loan accounts via Plaid to instantly sync balances, eliminating tedious manual data entry.
- Build a living dashboard: Your net worth figure updates automatically with live data, transforming a static spreadsheet into a real-time financial scorecard.
- Customize your financial view: Organize and group assets and liabilities exactly how you want, gaining full control over your financial reporting, unlike rigid apps.
- Understand growth drivers: Perform attribution analysis to clearly see if net worth changes are due to your savings/debt paydown or market movements.
- Forecast your future: Use native Python to easily project wealth, run "what-if" scenarios, and strategically plan for long-term financial goals.
Take control of your financial future. Try Quadratic.