
A single broken formula in your spreadsheet can quietly drain your profitability, especially considering that research indicates that a high percentage of business spreadsheets contain critical errors. When e-commerce teams rely on interconnected data to make fast decisions, a miscalculated cell can easily lead to sudden stockouts, wasted advertising spend, or wildly inaccurate profit margins.
For most e-commerce businesses, an operational performance report serves as the absolute lifeblood of decision-making. It is the central hub where leaders track sales, monitor inventory levels with robust inventory analytics, and evaluate PPC campaigns across multiple channels. Yet, while teams generally know exactly which metrics they need to track, they rarely know how to guarantee the underlying formulas calculating those metrics are actually correct or how to implement structured methodologies for spreadsheet auditing.
This vulnerability became glaringly obvious during a recent audit of a complex weekly operations report managing both FBA and FBM channels. The goal was simple: ensure the spreadsheet's formulas were accurate and aligned with the company's tracking instructions. Instead, the audit uncovered a web of structural mistakes. Here is a look at the hidden risks inside complex spreadsheets, the most common errors ruining e-commerce data, and how modern tools like Quadratic can bulletproof your reporting process.
The hidden risks in your operational performance report
Data integrity, built upon fundamental principles of data integrity, is the foundation of any successful e-commerce strategy. However, the sheer complexity of modern e-commerce reporting makes maintaining that integrity incredibly difficult. Building an operations performance report usually requires combining multiple interconnected sheets containing weekly sales units, refund rates, profit margins, landed costs, and ad spend.
When you force all of this dynamic data into a traditional spreadsheet environment, the file becomes fragile, exacerbating the inherent risks of interconnected data in modern business operations. Legacy tools make it notoriously difficult to trace errors across interconnected sheets. A broken reference in a raw data tab can cascade through your entire workbook undetected. This creates a dangerous false sense of security where business leaders make critical financial decisions based on numbers that look correct but are fundamentally flawed.
3 common formula errors ruining your e-commerce data
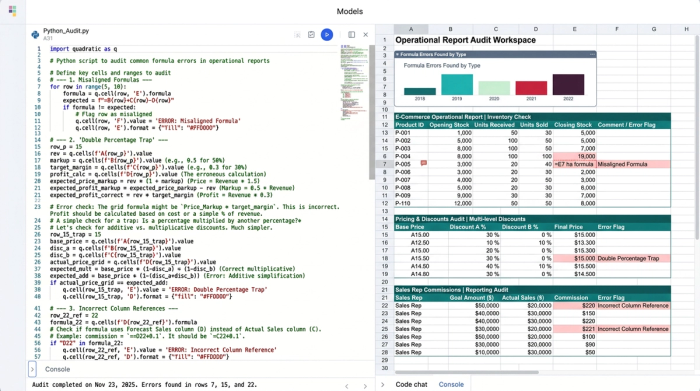
During the recent audit of the multi-channel FBA and FBM operations report, several alarming issues surfaced. These real-world horror stories highlight exactly why routine spreadsheet auditing is necessary for any data-driven team.
Misaligned formulas and shifted metrics
One of the most frequent issues discovered was formula misalignment caused by simple drag-and-drop errors. In complex sheets, it is easy for efficiency metrics to shift relative to their row labels. For example, a row clearly labeled "Conversion Rate" was accidentally pulling data from the "Refund Rate" calculations just one row below it.
The impact of this error is severe. When your labels and formulas decouple, leaders end up making operational decisions based on entirely wrong key performance indicators.
The double percentage trap
Formatting nightmares are another common culprit of bad data, with the double percentage trap being particularly prevalent. In the audited report, the creator had multiplied a calculation by 100 to yield a whole number. They then applied a standard percentage cell format to that same cell.
Instead of displaying a healthy 50% margin, the metric read 5000%. When left unchecked in an operational performance report, these skewed numbers completely distort profitability and margin tracking, making it impossible to know the true financial health of a product line.
Incorrect column references in trend comparisons
E-commerce relies heavily on week-over-week or month-over-month trend comparisons to dictate strategy. However, the audit revealed that several trend formulas were pulling from entirely incorrect columns. In one instance, a formula meant to analyze ad performance was pulling "clicks" instead of "impressions." In another, inventory trend data was referencing "stock values" instead of "clicks."
This type of reference error is disastrous for operations. It falsely identifies spikes or drops in performance, which can lead a team to make misguided PPC bid adjustments or place unnecessary inventory orders that tie up vital cash flow.
How to audit your spreadsheets with Quadratic
Traditional spreadsheets were simply not built to handle the rigorous demands of modern e-commerce reporting without breaking. Quadratic offers an antidote to these legacy spreadsheet errors. By combining the familiarity of a modern spreadsheet grid with native Python, SQL, and robust formula capabilities, Quadratic makes spreadsheet auditing intuitive rather than a manual chore.
In the audited FBA and FBM scenario, the core issue was the fragility of interconnected data. Quadratic handles diverse data sources like sales, inventory, advertising, and financial data reliably in a single workspace. Because you can pull live data directly from databases or APIs and manipulate it using code or AI alongside standard formulas, the environment is inherently more stable. This prevents the fragility that causes misaligned formulas and broken column references.
The ultimate goal of any operations team is to achieve formula accuracy alongside reliable trend comparisons. With Quadratic, leaders can finally trust their data for high-stakes operational decision-making, knowing the logic and context are secure within a powerful, AI-native workspace.
Core metrics every e-commerce operations report must track
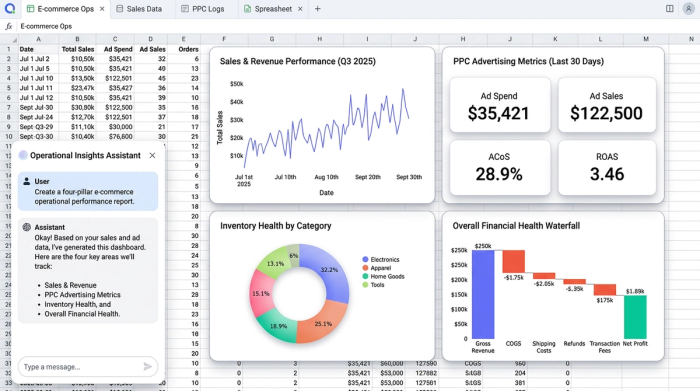
When building or auditing your operational performance report, it is vital to focus on the numbers that actually drive the business. Based on the successful workflows of top e-commerce managers, your reporting should center on a few essential pillars.
First, you need clear visibility into sales units and revenue, properly segmented by FBA and FBM channels, often supported by a sales funnel calculator to optimize conversions. Second, PPC metrics such as total ad spend, impressions, and clicks must be tracked alongside those sales to measure acquisition efficiency, often relying on real-time Google Analytics data for accuracy. Third, inventory health and stock levels are non-negotiable to prevent costly stockouts, and a fill rate calculator can significantly aid in tracking fulfillment efficiency. Finally, overall financial health must be monitored through accurate tracking of refunds, landed costs, and true profit margins. Effective ecommerce product data management is crucial for ensuring the accuracy of these figures.
However, keeping a list of these e-commerce metrics is only half the battle. They are only as valuable as the formulas calculating them.
Conclusion: stop guessing, start auditing
An unaudited report is a massive liability. As the recent FBA and FBM audit proved, even a few misaligned cells or formatting traps can completely derail your understanding of your business. Regular audits for formula accuracy are essential for maintaining the data integrity required to scale.
It is time to stop relying on fragile, legacy spreadsheets that hide critical errors. Try Quadratic to build reliable, interconnected operational performance reports that offer speed, clarity, and instant insights. With a modern AI spreadsheet, you can secure your data logic and confidently make the operational decisions that drive your business forward.
Use Quadratic to audit operational performance reports
- Ensure formula accuracy: Combine standard formulas with native Python and SQL for rigorous, auditable logic across all your e-commerce data.
- Eliminate cascading errors: Connect live data from sales, inventory, and advertising sources in a single, stable environment, preventing misaligned formulas and broken references.
- Trust your key metrics: Avoid common pitfalls like formatting errors and incorrect column references, ensuring profit margins and trend comparisons are always reliable.
- Make confident decisions: Secure data logic and context within an AI-native workspace, so you can trust your operational performance report for high-stakes business choices.
Stop relying on fragile spreadsheets. Build operational performance reports you can trust. Try Quadratic.