What you’ll get
- Top merchants summary table
- Spending concentration table
- Frequent merchants summary
- Plain-language takeaways
What this credit card spend recipe does
This recipe performs a top merchants and spending concentration review to help you identify exactly where your money is going. By acting as a dynamic credit card spending calculator, it aggregates transaction data across multiple accounts so you can analyze spending patterns over time.
The workflow automatically surfaces which merchants appear frequently or follow a recurring cadence. It also highlights the merchants with the largest recent changes in transaction volume, giving you a clear view of how your spending behavior is shifting.
What data it uses
To run this analysis, the recipe requires a single connected Plaid account. It pulls raw transaction data directly from the selected connection and automatically filters out pending transactions, negative amounts, loan payments, and outgoing transfers.
To ensure the analysis focuses strictly on true merchant spending, it relies on Plaid category labels to exclude internal transfers and refunds. The accuracy of the grouping and normalization depends on the quality of the Plaid merchant names provided by the connection.
How the workflow progresses
The recipe begins with a discovery step that inspects your connected accounts and groups them by type. It estimates the available transaction date coverage to determine the best default reporting windows. During this phase, it also assesses merchant name quality, applies conservative normalization to obvious variants, and detects likely internal transfers, credit card payments, and refunds to prevent them from skewing your analysis.
Before building the dashboard, the workflow pauses to present two account-scope options: spending-relevant accounts only or all accounts in the connection. It waits for you to select an account scope before proceeding.
Once a scope is chosen, the recipe generates a reusable source table containing all available history for the chosen accounts. It then applies date filtering at the presentation layer via Python, allowing you to adjust timeframes seamlessly without restricting the underlying source table.
What outputs it creates
The workflow builds a comprehensive credit card breakdown spreadsheet equipped with editable start and end date controls. The resulting dashboard includes:
- Current filters section: Details the connection name, selected account scope, transfer exclusion status, and the active date range.
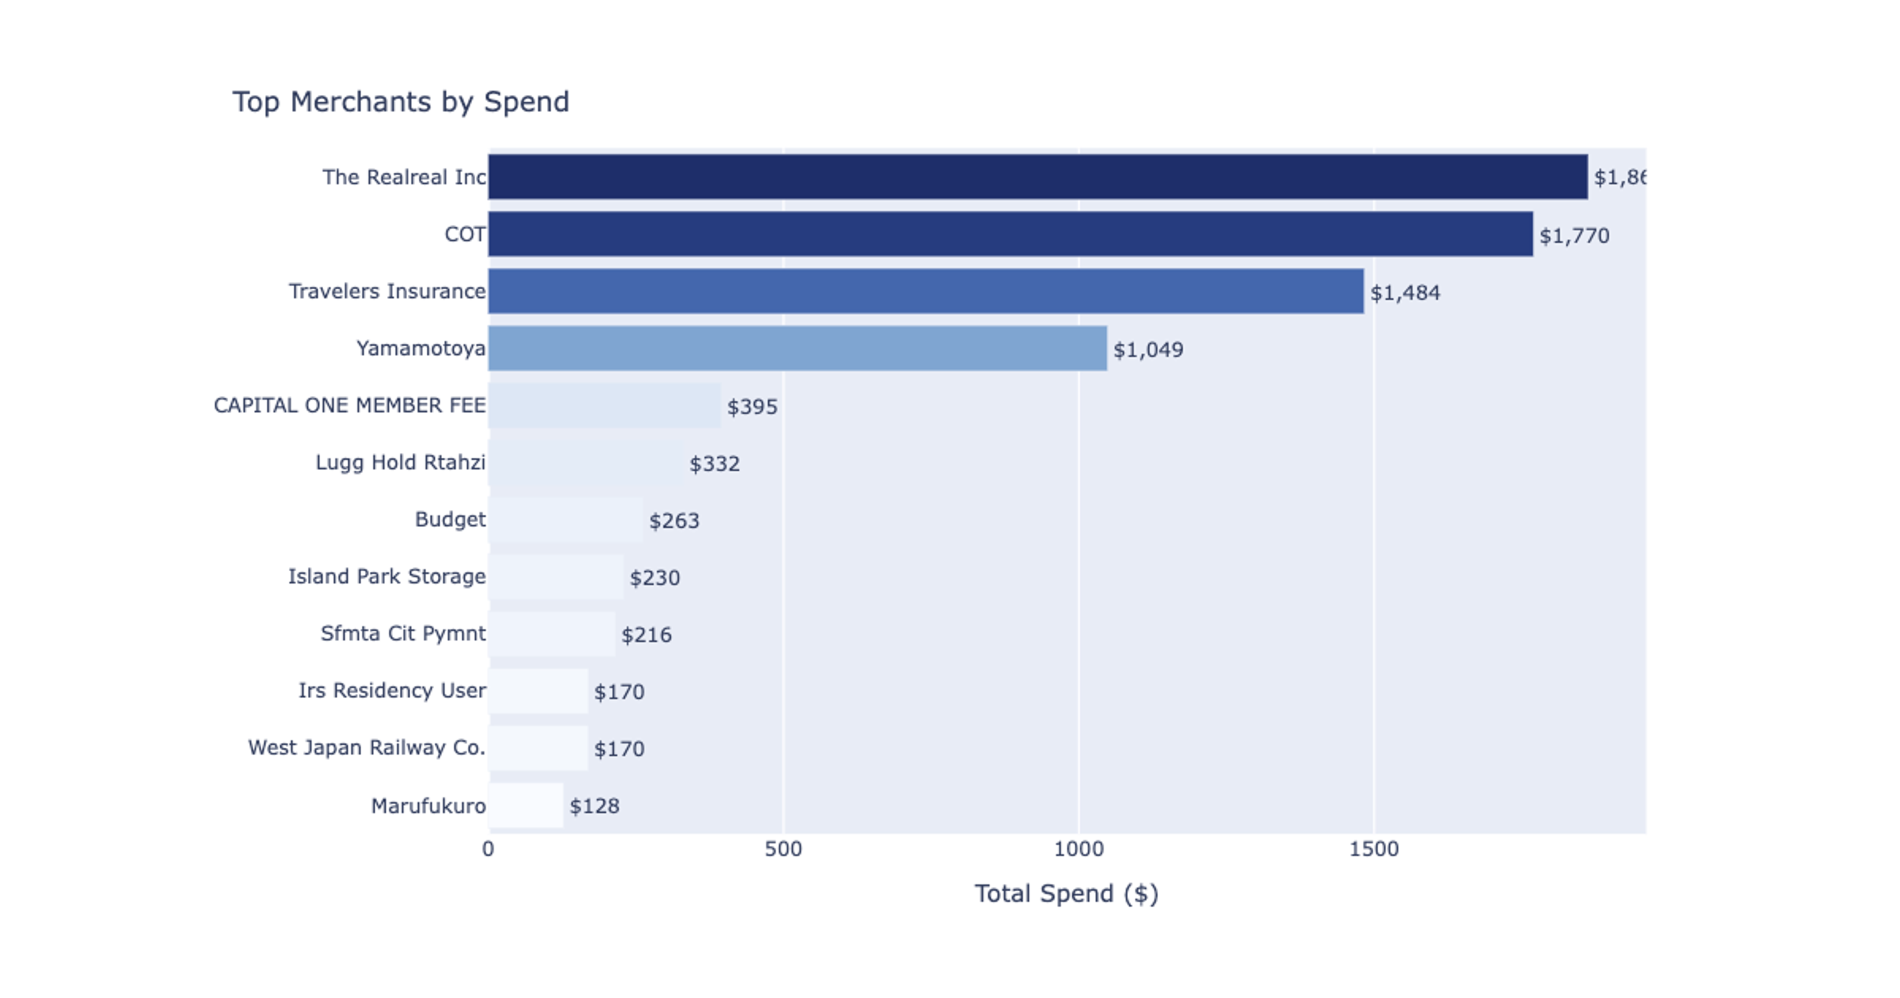
- Top Merchants summary: Shows total spend, transaction count, average amount, last transaction date, and percent of total spend per merchant.
- Spending Concentration table: Displays the total merchant count, top-5 and top-10 share of spend, and a qualitative concentration label.
- Frequent Merchants summary: Identifies merchants with two or more transactions and classifies their cadence pattern.
- Merchant Movers comparison: Compares a recent 30-day window to the prior 30 days, showing dollar and percentage changes to highlight shifting spend.
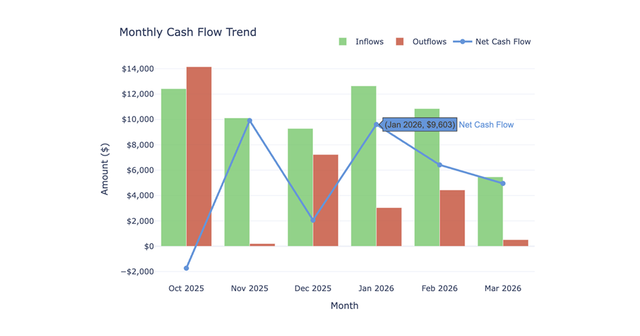
- Visualizations: Plots a horizontal bar chart of top merchants by spend and a cumulative concentration curve chart with reference lines at 50% and 80%.
- Plain-language takeaways: Summarizes the most notable findings and spending behaviors in the current date range.
Optional merchant drilldown
After the main dashboard is built, the recipe supports an optional follow-up analysis. You can select a specific merchant from the dashboard for a deeper review. Where the schema allows, this generates a specific credit card payment breakdown showing the full transaction history and frequency patterns for the chosen merchant. It displays the spending trend, identifies which accounts were used for that merchant, and provides a short text summary of what stands out about that specific spending pattern.
Who this Credit Card Spend Analysis recipe is for
- Individuals wanting to track their top merchants and spending concentration
- Analysts reviewing recurring merchant charges and subscription cadences
- Users who need to identify sudden changes in merchant spending behavior compared to a prior period