What you’ll get
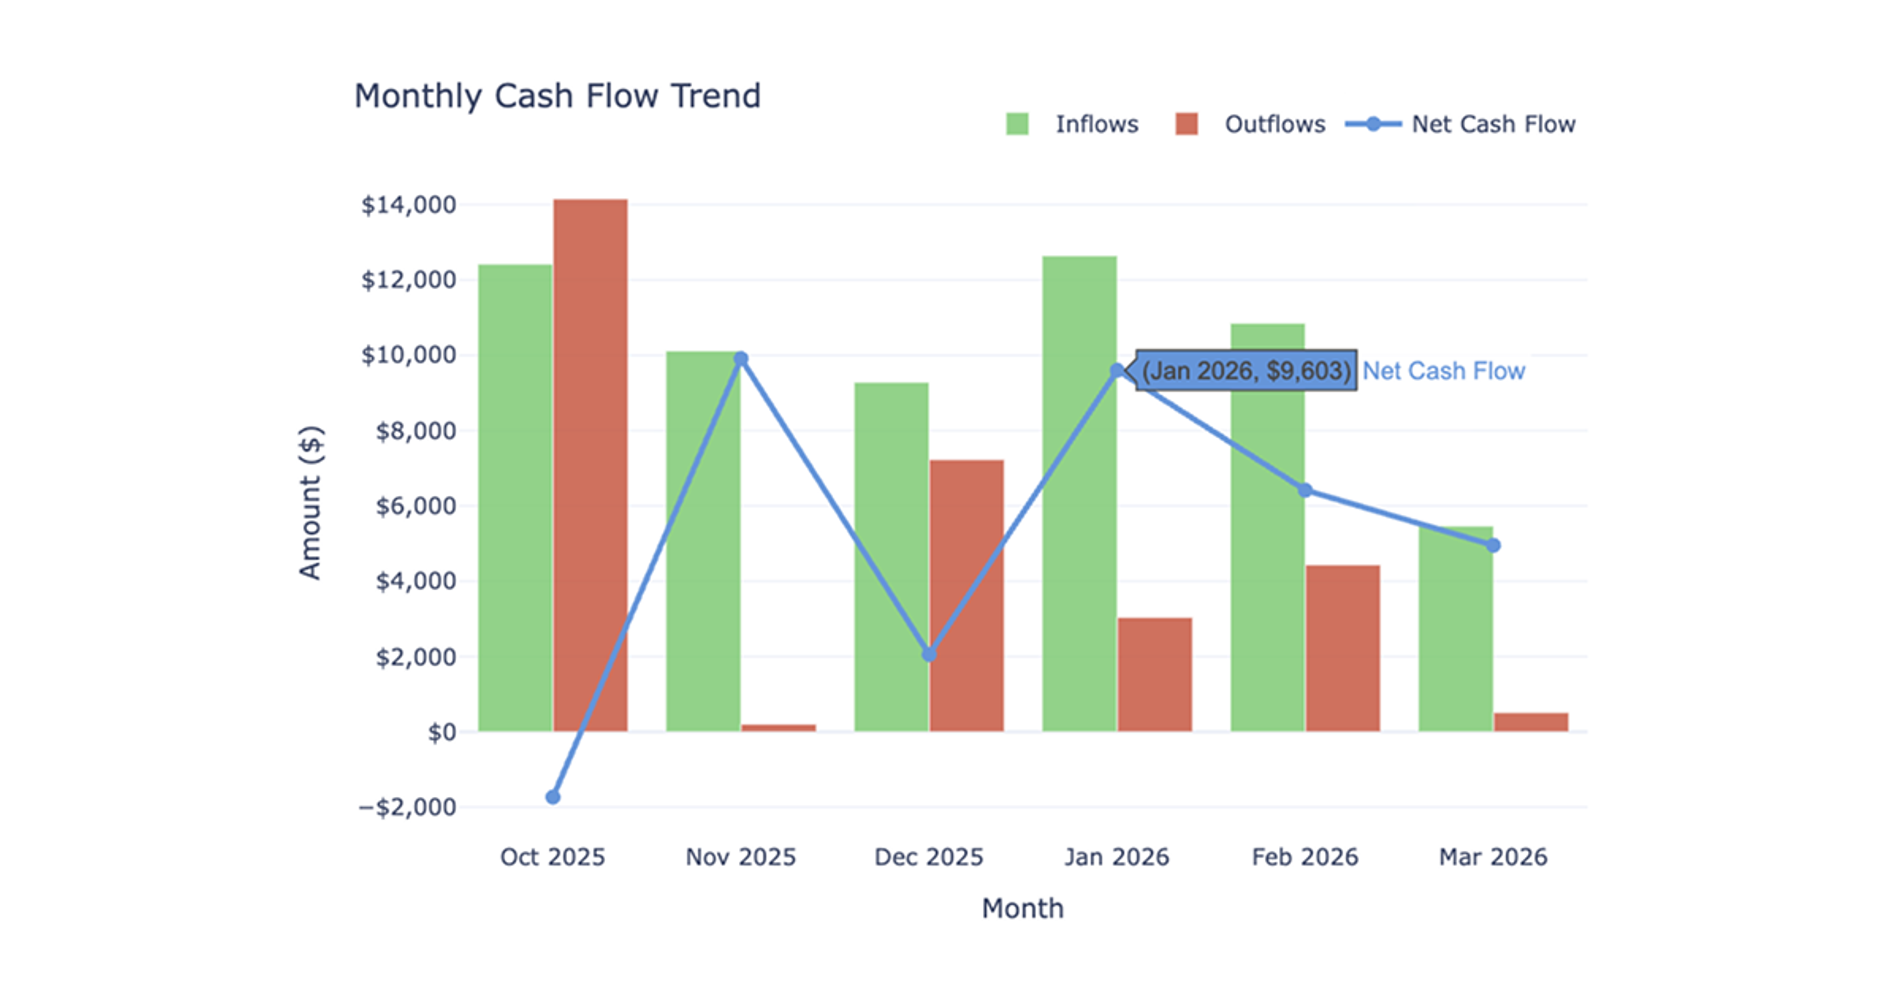
- Monthly cash flow trend chart
- Top spending categories chart
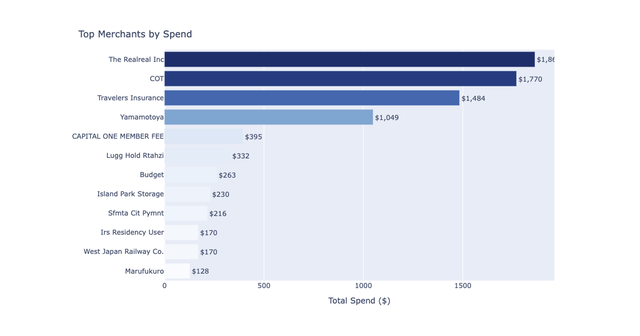
- Top ten merchants table
- Account contribution summary
- Plain-language takeaways
What the cash flow analysis dashboard does
The cash flow analysis dashboard recipe builds a clean, monthly tracking view of your financial health. It automatically calculates inflows, outflows, and your overall net position to give you an accurate picture of your spending habits. To prevent inflated totals, the recipe automatically excludes likely internal transfers, credit card payments, and investment movements.
This workflow breaks down your spending by primary category, specific merchants, and contributing accounts. The dashboard also features interactive date controls, allowing you to instantly update all visual outputs to reflect different time periods without requiring new data queries.
What connected data it uses
This recipe requires a single Plaid connection and uses raw transaction data across your available connected accounts.
- Derives inflows from negative transaction amounts and outflows from positive transaction amounts
- Relies on Plaid's primary personal finance categories to generate spending breakdowns
- Infers account types based on transaction patterns rather than requiring a dedicated accounts table
How the workflow progresses
The workflow begins with an initial discovery step that inspects your connected transaction data. It identifies available accounts, estimates your date coverage, assesses category data quality, and detects likely internal transfers to establish exclusion rules.
After this assessment, the recipe pauses to present a recommended account scope. It typically suggests focusing on spending-relevant accounts only. Once you confirm your desired account scope, the main build proceeds.
The recipe then creates four reusable connection tables containing all available transaction history for your selected scope. Finally, it applies dashboard date controls at the visualization layer, ensuring the reusable base data is filtered smoothly as you adjust the visible time window.
What the recipe produces
Running this recipe generates a complete, interactive dashboard directly in your spreadsheet.
- A dashboard controls section with editable start and end date cells, defaulted to the most recent six months
- A filters and assumptions panel displaying the active connection, account scope, and transfer exclusion status
- A combined bar and line chart visualizing monthly inflow, outflow, and net cash flow trends
- A horizontal bar chart showing top spending categories by total outflow
- A summary table listing the top ten merchants by outflow
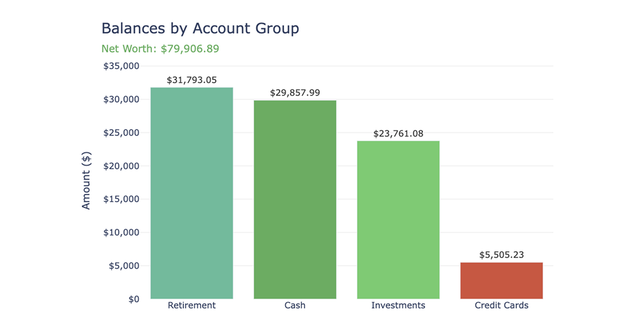
- An account-level contribution summary detailing inflows, outflows, and net cash flow per account
- An auto-generated takeaways section highlighting best and worst months, dominant spending areas, and your overall net position
Additionally, the recipe supports one optional follow-up path to analyze recurring and subscription spending where the schema allows.
Who this cash flow analysis dashboard recipe is for
- Users who need a clean, first-time view of their monthly financial health
- Individuals looking to consolidate transaction data across multiple checking, savings, and credit card accounts
- Users who want to quickly identify top spending categories and merchants without manually categorizing transactions
- Anyone needing an interactive financial summary that automatically filters out internal account transfers