James Amoo, Community Partner
Mar 3, 2026

If you are serious about personal finance, you have likely faced a common dilemma: should you use a budget app or spreadsheet to manage your money? It is a choice that often feels like a trade-off between two extremes. On one side, you have dedicated budgeting apps that offer sleek interfaces and automated syncing, but force you into rigid categories. On the other hand, you have traditional spreadsheets like Excel and Google Sheets that offer infinite flexibility but require tedious manual data entry.
Most people start with budget apps for the convenience. It feels magical to see transactions appear automatically on your phone. However, as your financial life grows more complex, the app’s limitations become visible. Conversely, the blank canvas of a spreadsheet is intimidating, and the prospect of manually downloading CSV files every month is enough to make anyone quit.
This article explores a third option that many advanced users are moving toward: a hybrid approach that combines the automation of modern apps with the analytical power and customization of a spreadsheet.
The case for budgeting apps: convenience at a cost
Budgeting apps are designed to reduce friction. They connect to your bank accounts, pull in transactions, and categorize them automatically. For beginners or those who simply want a quick snapshot of where their money went in a month, this approach works just fine. The low barrier to entry means you can start tracking your finances in minutes without needing to understand formulas or data structures.
However, this convenience comes with significant rigidity. Most apps force you to adopt their budgeting philosophy, whether that is zero-based budgeting or envelope packing. If your financial reality doesn't fit their model, you hit a wall. You cannot easily query your data to answer specific questions, and you are often limited to generic pie charts that don't tell the full data story of your financial health.
There is also the issue of subscription fatigue. Many users find themselves paying a monthly fee for an app that essentially acts as a data aggregator, locking their financial history inside a proprietary database that exports poorly.
The case for traditional spreadsheets
For those who crave control and flexibility over their financial data, spreadsheets have always been the standard. In a spreadsheet, you own the data. You can build any model you want, rename categories to fit your life, and create custom finance visualizations.
The downside of traditional spreadsheets is the manual labor required to maintain them. Downloading CSV files from five different banks, formatting the columns to match, and fixing broken cell references is a chore. Over time, the friction of data entry outweighs the benefits of customization. You end up spending all your time performing data cleaning and transformation rather than analyzing.
Even when the effort is sustained, traditional spreadsheets introduce a hidden risk of fragility. A single overwritten entry between datasets can quietly corrupt months of financial data analytics. Version control is often nonexistent, collaboration becomes confusing, and reconciling changes across devices or contributors can quickly spiral into guesswork.
Budget app vs spreadsheet: choosing a hybrid solution
The binary choice between a rigid app and a manual spreadsheet is outdated. A hybrid workflow solves the core problems of both. With this approach, you use modern integrations to automate the ingestion of transaction data, but you feed that data into a flexible IDE for data analysis.
This approach works because it separates data collection from business data analysis. You no longer have to choose between spreadsheet automation and customization. By piping live financial data directly into a spreadsheet, you eliminate the manual tedium of CSVs. Once the data is there, you have a flexible canvas to build the exact reports you need.
This allows you to move from simple tracking (looking backward at what you spent) to financial data modeling (looking forward at what is possible). It is the ideal setup for users who have outgrown basic apps but refuse to spend their weekends manually typing in receipts.
Advanced strategies for finance data management
With a hybrid workflow, you can perform analyses that are not possible in standard apps. Let’s explore some strategies for managing your financial data.
Multi-year analysis
Most consumer finance apps are optimized around short reporting windows, typically the current month or, at best, a rolling year. That makes them excellent for answering operational questions like “Did I overspend on groceries this month?” but weak at answering strategic questions such as “How has my cost of living changed over time?”
With AI data analysis tools or Python embedded directly in a coding spreadsheet, you can automate calculations such as compound growth rates, rolling averages, and anomaly detection. Instead of reacting to monthly surprises, you gain a macro view of your financial trajectory, which is what enables decisions like relocating, renegotiating recurring bills, or adjusting long-term savings targets.
Forecasting cash flow
Cash flow forecasting shifts personal finance from reactive tracking into predictive planning. Traditional budgeting apps typically assume static monthly income and expenses, which breaks down quickly if your financial life includes bonuses, freelance work, or annual obligations.
With Python or SQL data analytics, you can project your daily or weekly bank balance several months into the future, incorporate recurring expenses with different frequencies, or model probabilistic income. Instead of discovering a cash shortage when your account balance drops unexpectedly, you can see potential liquidity problems months ahead.
Complex scenarios
Real financial lives rarely fit into clean categories or single-income assumptions. Many people manage multiple revenue streams, shared expenses, or overlapping financial goals that standard apps struggle to represent without awkward workarounds.
Irregular freelance income, for example, can be tagged by client, project, or expected payment date, allowing you to track receivables alongside actual deposits and understand future earnings at a glance. Shared household expenses can be split dynamically using formulas that automatically calculate reimbursements between partners without duplicating transactions or creating manual adjustments.
The same flexibility applies to savings goals, where portions of a single account balance can be allocated toward travel, emergencies, or major milestones like a wedding while still maintaining an accurate overall cash position.
How to make a budget spreadsheet app using Quadratic
Quadratic is uniquely positioned to handle this hybrid workflow. It combines the interface of a spreadsheet with the power of Python, SQL, and direct data integrations, making it one of the best spreadsheet apps for budgeting. Let’s explore how you can set up a system that runs itself:
Step 1: Connect to your data
The foundation of any self-running workflow is automated data ingestion. Manual entry introduces delays, errors, and inconsistency, especially when managing multiple accounts across banks, credit cards, or investment platforms. Quadratic integrates with Plaid, allowing you to securely connect financial accounts directly into the spreadsheet environment. Transactions sync automatically into structured tables, removing the need to download CSV files or reconcile numbers across platforms.
Step 2: Analyze with Quadratic AI
Once data flows automatically into the spreadsheet, the next step is transforming it into actionable insights. Traditional spreadsheet formulas work well for simple calculations, but often become fragile as datasets grow.
Let’s see how this works in Quadratic. First, I import a sample dataset:
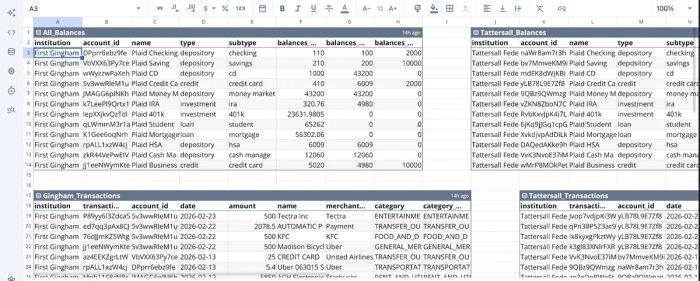
The image shows financial data consolidated from different channels, which isn’t possible using a budget app. Even though this approach introduces an extra layer of complexity in working with your data, Quadratic allows you to perform question-driven data analysis using simple text prompts. Suppose I want to analyze my spending patterns using on several categories:
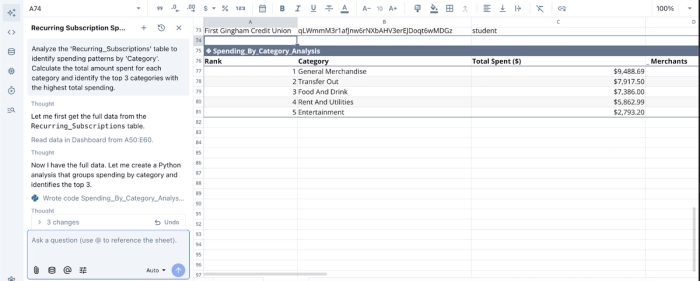
In the image above, I prompt Quadratic AI to “Analyze the Recurring_Subscriptions table to identify spending patterns by Category. Calculate the total amount spent for each category and identify the top 3 categories with the highest total spending.” It instantly generates a table showing the breakdown of my finances across several categories.
Quadratic also supports Python and SQL for data analysis. This enables advanced analytics directly inside the spreadsheet. You can calculate rolling averages to smooth volatile income patterns, detect anomalies such as duplicate charges, or build forecasting models that estimate future account balances.
Step 3: Visualize your way
Visualization is where analysis becomes actionable. Many finance apps restrict users to predefined dashboards designed for broad audiences. While convenient, those views rarely reflect individual priorities or complex financial situations.
Working inside a spreadsheet environment allows complete control over presentation. You can build dashboards that answer highly specific questions, such as how quickly savings are growing relative to expenses, whether investment performance outpaces inflation, or how discretionary spending affects long-term goals.
Quadratic allows you to create dashboards based on your financial data by using text prompts. It functions as a data visualization software that streamlines the creation of interactive visualizations using Python visualization libraries. Here’s an example of a financial dashboard created in Quadratic:
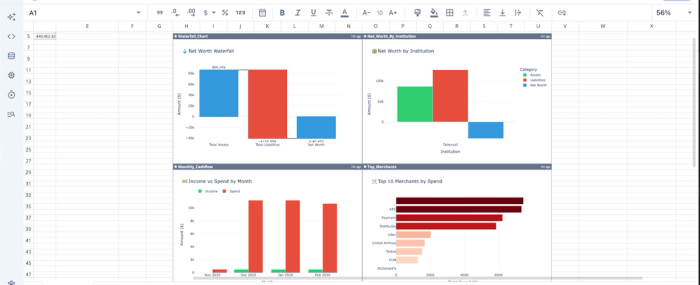
With Quadratic, I was able to create a financial dashboard based on my data, displaying insights into the net worth waterfall, net worth by institution, top merchants by spend, and an income vs spend distribution.
Since the underlying data connection is automated, these dashboards require minimal maintenance. Charts update themselves as new transactions arrive, allowing you to turn your spreadsheet into a living financial command center. Over time, this continuity helps you notice patterns earlier, whether it is creeping subscription costs or gradual improvements in savings discipline.
Conclusion
You do not have to choose between a budget app or spreadsheet. The binary choice between convenience and control is a false one. If you want simple tracking with zero effort, an app is fine. If you want total control but lots of manual work, a classic spreadsheet works. But if you want financial mastery, a hybrid workflow is the superior choice.
Quadratic offers a hybrid workflow that allows you to combine automated data feeds with the analytical power of a modern spreadsheet, helping you gain the clarity needed to truly manage your wealth. Try Quadratic for free.
Frequently asked questions (FAQs)
What is the main challenge when choosing a budget app or spreadsheet?
The primary challenge lies in the trade-off between convenience and control. Budget apps offer automated syncing but are often rigid, while traditional spreadsheets provide infinite flexibility but demand tedious manual data entry. This typically forces users to choose one extreme over the other.
What is a hybrid workflow for managing personal finances?
A hybrid workflow combines the automated data ingestion typically found in modern budgeting apps with the analytical power and customization of a flexible spreadsheet environment. This approach eliminates the manual tedium of data entry while empowering users to build custom reports and perform advanced financial modeling. It resolves the "budget app or spreadsheet" dilemma by offering the best of both worlds.
How does Quadratic help resolve the budget app or spreadsheet dilemma?
Quadratic addresses this by integrating direct connections to financial accounts for automated transaction data syncing, much like a budget app. It then feeds this live data into a flexible spreadsheet environment where users can apply Python, SQL, and AI tools for custom categorization, deep analysis, and personalized visualizations. This allows for both automation and comprehensive control over your financial data.