Purpose of the earnings call transcript analysis framework
This template provides a comprehensive earnings call transcript analysis framework that centralizes financial data, market reactions, and transcript text into a single workspace, enabling efficient automated financial reporting. By connecting live financial data with qualitative text parsing, it enables robust financial data analysis, eliminating the need to switch between different tools during earnings season.
- Centralizes financial data, stock price reactions, and transcript text into a single workspace
- Automates year-over-year financial comparisons and daily stock return calculations
- Generates interactive charts for revenue, margins, price action, and transcript themes, providing clear financial data visualization.
- Provides structured manual workspaces for qualitative notes and key moment tracking
How the data flows
Unidirectional architecture
The template operates across five distinct sheets: Inputs, Financials, Analysis, Charts, and Summary. Data flows in a strictly unidirectional pattern, pushing outward from the Inputs sheet to all other dependent sheets in the workbook. Python code cells on the dependent sheets pull user parameters using cross-sheet references like q.cells("'Inputs'!B6") to ensure consistency across the analysis.
Automated execution
Because of the unidirectional flow, changing any value on the Inputs sheet triggers automatic re-execution of all dependent Python code. The template fetches live financial statements and historical stock prices using Quadratic's native q.financial API. Transcript text is processed locally within the spreadsheet using regex-based keyword counting to categorize themes and sentiment.
Core template components
Inputs sheet
The Inputs sheet houses all user-configurable parameters in cells B6 through B12. These parameters include fields for the ticker symbol, company name, fiscal year, earnings date, and the size of the pre- and post-earnings trading windows. A list validation dropdown is used to constrain the fiscal quarter selection to Q1 through Q4 or FY. Cell B16 contains a dedicated free-text field for pasting the raw earnings call transcript.
Financials sheet
This sheet uses the Financial_Comparison Python cell to fetch income statement and cash flow data for both the current and prior fiscal year. It extracts specific metrics using a tag-based dictionary lookup with fallback chains (trying 'totalrevenue' and then 'operatingrevenue' if needed). The cell computes derived values like gross margin and free cash flow for year-over-year comparison. A separate Price_Reaction Python cell calculates daily percentage returns for the defined pre- and post-earnings windows.
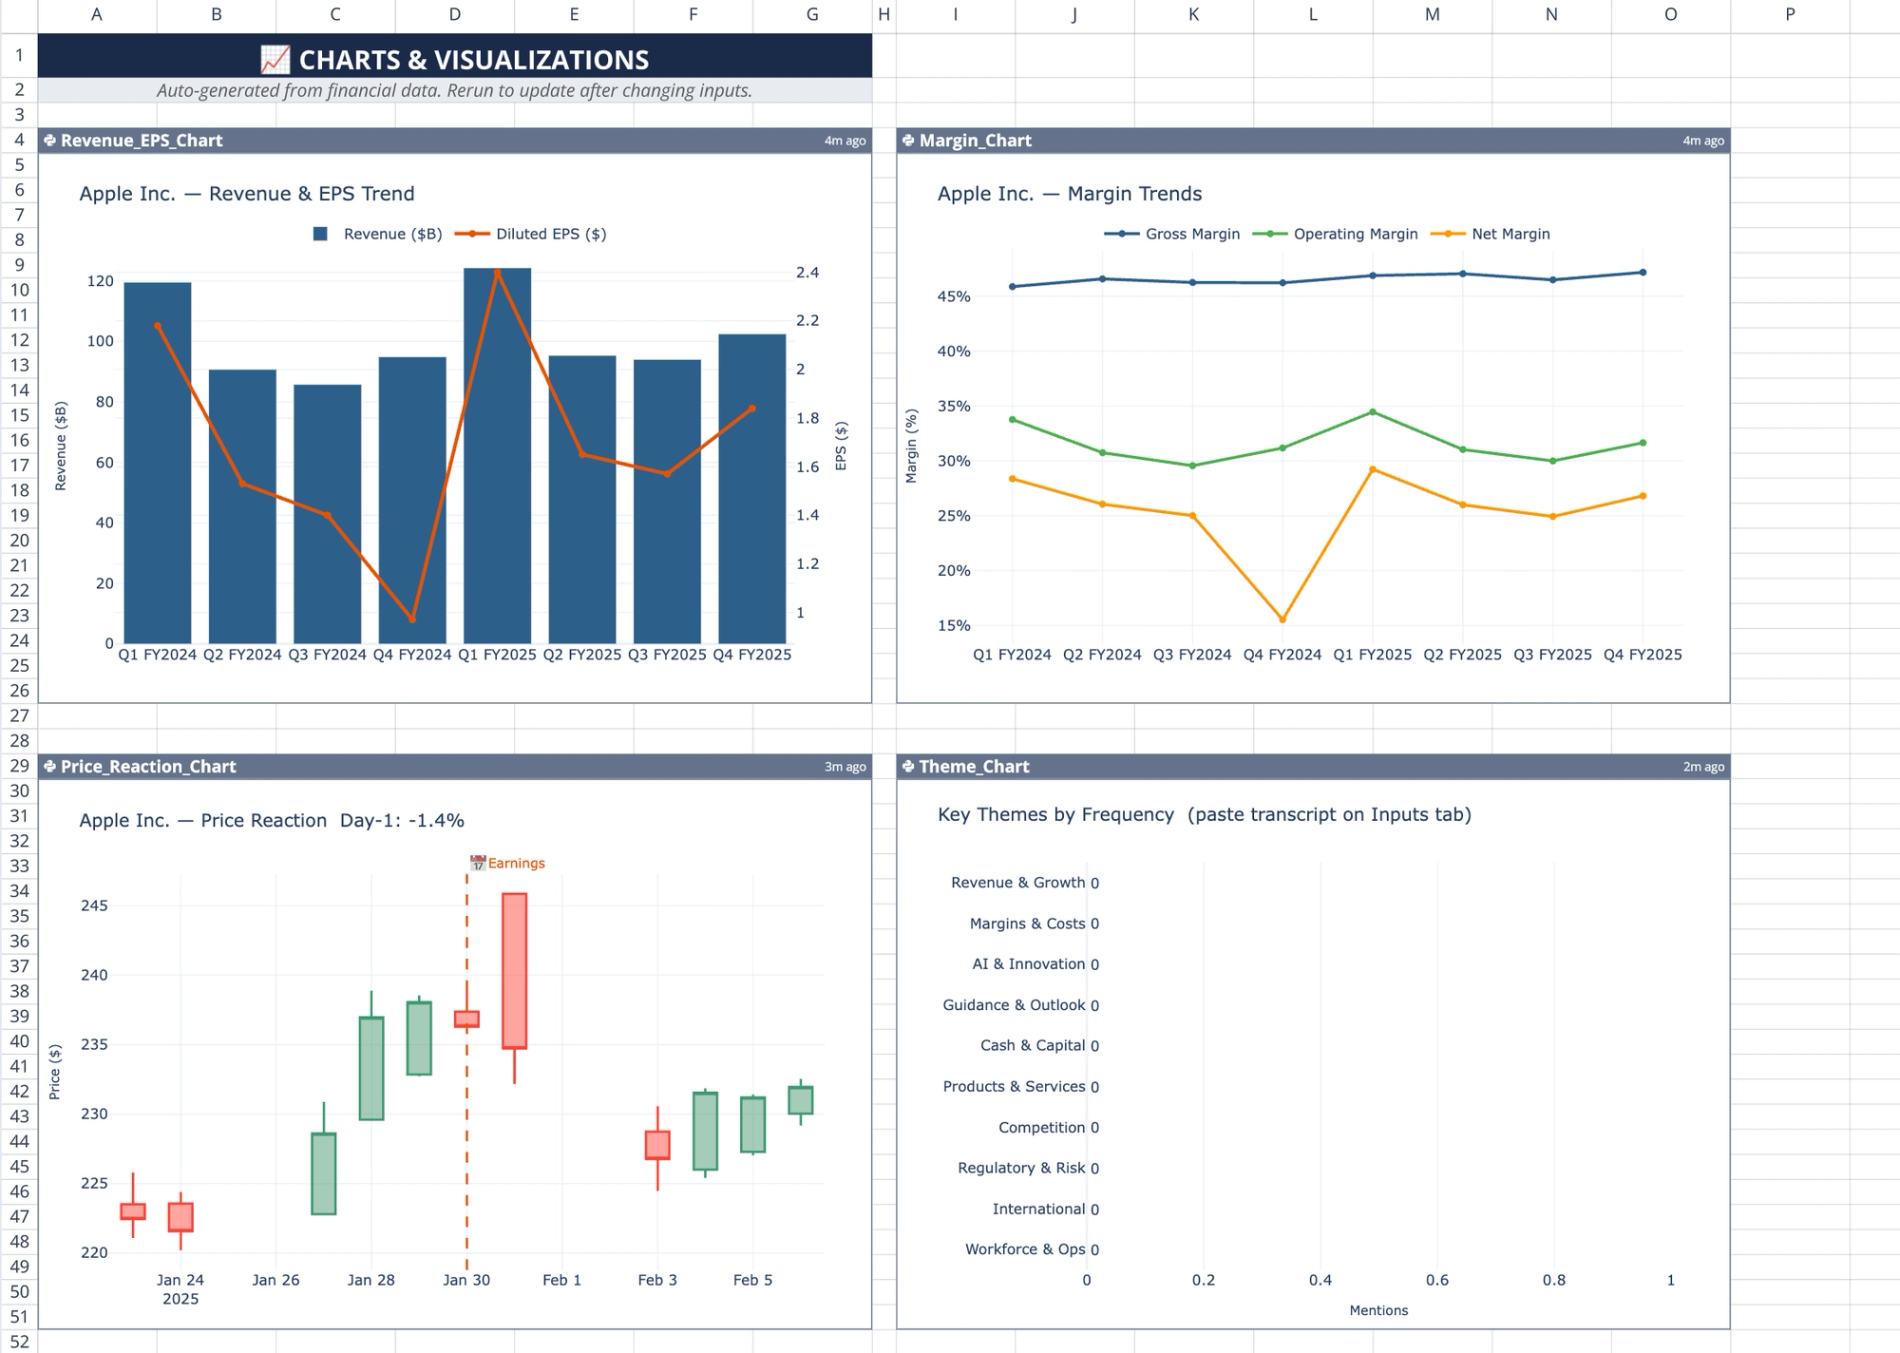
Charts sheet
The Charts sheet contains five independent Plotly visualizations. The Revenue_EPS_Chart and Margin_Chart loop through eight quarters of data to build trend DataFrames for revenue, diluted EPS, and margin percentages. A candlestick chart displays the stock price reaction with a dynamically drawn vertical line marking the earnings date. For text analysis, a horizontal bar chart tallies transcript themes across ten predefined topic categories. The sheet also performs earnings call sentiment analysis by counting bullish and bearish keywords to render a stacked bar chart.
Analysis sheet
The Analysis sheet provides a manual workspace with labeled sections for logging qualitative research notes. It features a structured Key_Moments data table with specific columns for Speaker, Topic, Quote, Sentiment, Relevance, and Why It Matters. To maintain clean data entry, the Sentiment and Relevance columns utilize list validation dropdowns.
Summary sheet
The Summary sheet combines a manual template for qualitative observations with an auto-generated Python cell named Research_Summary. This cell re-fetches the necessary financial and stock price data independently to compile a comprehensive overview. It outputs a formatted, plain-text financial summary within a single-column DataFrame.
How to use the template
Configuring the inputs
Start by entering the target ticker symbol (for example, INTC for an intel intc recent earnings call analysis) and the company name. Select the specific fiscal quarter from the dropdown and define your preferred trading day window sizes for the price reaction analysis. Finally, paste the full text of the earnings call into the designated transcript field.
Reviewing automated outputs
Navigate to the Financials sheet to review the year-over-year metric comparisons and derived margin calculations. Next, check the Charts sheet to visualize the historical revenue trends, the immediate stock price reactions around the earnings date, and the overall transcript sentiment.
Capturing qualitative insights
Use the Analysis sheet to log specific quotes from management and assign sentiment ratings within the structured table. Once you have reviewed the automated data and logged your notes, synthesize your final findings in the Summary sheet alongside the auto-generated financial text.
Who this earnings call analysis template is for
- Financial analysts tracking quarterly corporate performance and immediate market reactions
- Equity researchers conducting historical transcript sentiment analysis across multiple quarters
- Investors needing a centralized dashboard that combines hard financial metrics with qualitative call notes
Use Quadratic to do earnings call analysis
- Centralize financial data, stock price reactions, and transcript text in one workspace.
- Automate year-over-year financial comparisons and daily stock return calculations.
- Generate interactive charts for revenue, margins, price action, and transcript themes.
- Process earnings call transcripts locally to categorize themes and sentiment.
- Log qualitative research notes and track key moments in structured tables.
- Automatically re-execute all analysis and charts by simply changing input parameters.
Related templates
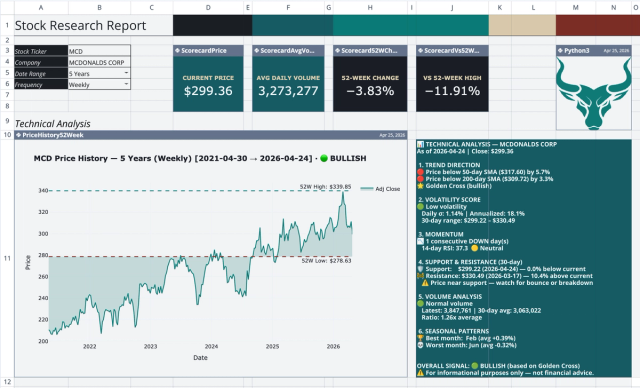
Stock Research Report Template: Live Stock Dashboard
Analyze a single stock's financial performance and risk.
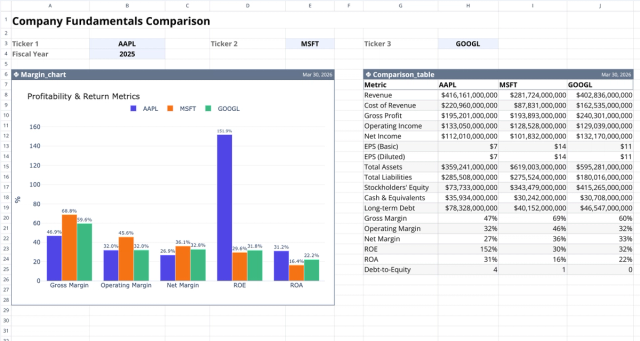
Fundamental Analysis Template: Compare Stocks
Compare fundamental financial metrics and profitability across companies.
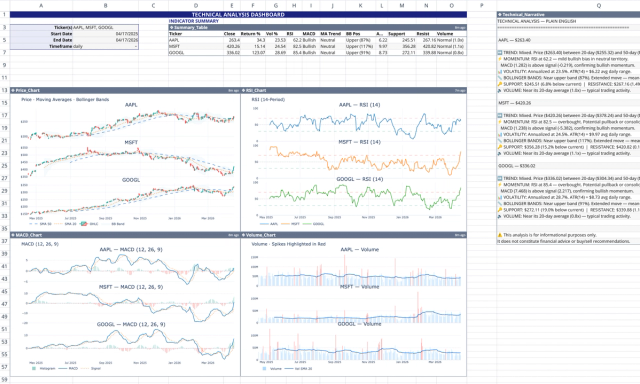
Technical Analysis Template: Live Stock Dashboard
Analyze live market data with technical indicators, narrative, and charts.