Table of contents
- The core components of cost analysis in manufacturing
- The problem with standard manufacturing cost analysis templates
- Real-world workflow: how to automate cost analysis in manufacturing design and production
- Key profitability metrics to track in your consolidated dashboard
- Upgrade your manufacturing cost analysis workflow
Accurate cost analysis is the lifeblood of manufacturing profitability. However, textbook formulas rarely prepare financial managers and operations analysts for the reality of fragmented and messy data. Most teams start with a standard manufacturing cost analysis template to track their expenses. This approach works in theory, but a typical manufacturing cost analysis template excel breaks down the moment your data is incomplete, scattered across different systems, or trapped in a static PDF document.
To uncover true profitability, you need to look beyond rigid spreadsheets. This article will cover the essential cost categories you need to track and demonstrate a real world workflow using Quadratic. By the end, you will see how to consolidate messy data into a clear profitability overview that drives smarter operational decisions.
The core components of cost analysis in manufacturing
Before diving into advanced data workflows, it is important to establish the standard buckets of expenses involved in cost analysis in manufacturing. Understanding these categories is the first step toward building a reliable financial model.
Direct costs are the expenses tied directly to production. This includes direct labor and raw materials, often tracked as a precise material cost per kilogram or unit.
Overhead and operational costs encompass the facilities and utilities required to keep the factory running. These are typically split into fixed and variable costs like rent and electricity and equipment maintenance.
Financial and hidden costs cover the less obvious expenses that eat into your margins. These include loan repayments, factoring fees, and logistics. Advanced teams also incorporate cost to serve analysis into this bucket to understand the true expense of fulfilling customer orders and maintaining specific client relationships.
The problem with standard manufacturing cost analysis templates
The biggest gap in modern financial analysis is the assumption that your data is perfectly formatted and ready to be plugged into a standard template. In the real world, manufacturing data is notoriously messy.
Financial data is often scattered across multiple disparate tables. Crucial operational expenses are frequently trapped in static vendor PDFs, such as monthly utility bills, loan statements, or factoring agreements. Furthermore, production planners constantly battle incomplete sales records that make it nearly impossible to calculate accurate margins.
To truly understand your cost structure, you need a dynamic workspace that can bridge these data gaps. Traditional spreadsheets force you into manual data entry and brittle formulas, leaving you vulnerable to errors and outdated information.
Real-world workflow: how to automate cost analysis in manufacturing design and production
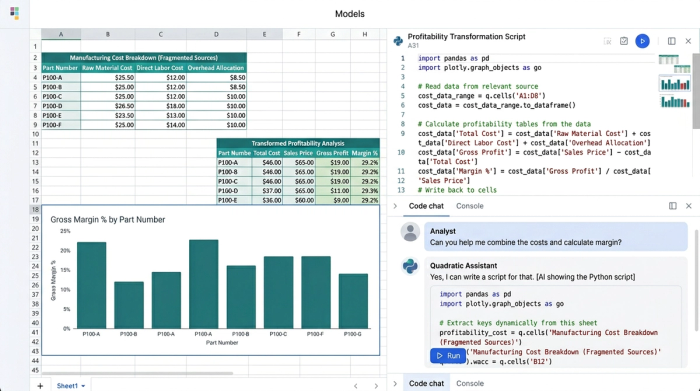
Let us look at a realistic scenario. A manufacturing analyst is tasked with creating a structured profitability table to support an internal financial review. Their data includes partial sales records, production cost tables, and static PDFs containing rent, electricity, and loan expenses.
To solve this, the analyst uses Quadratic. As a modern manufacturing cost analysis software, Quadratic combines the familiarity of a spreadsheet with the power of native Python and SQL. This allows the user to handle messy constraints and perform a comprehensive manufacturing cost analysis in a single unified grid. Here is how to automate cost analysis in manufacturing design process workflows when faced with imperfect data.
Step 1: Extracting and importing data from messy sources
The first hurdle is getting all the data into one place, especially when crucial numbers are locked in static documents.
- Use built in AI flows to import unstructured data directly from PDFs into the spreadsheet grid, leveraging automated data extraction capabilities.
- Extract utility expenses, rent invoices, and factoring amounts without manual data entry.
- Pull this newly structured data alongside standard CSV or database imports of your core production costs.
Step 2: Categorizing fixed, variable, and multi-currency costs
Once the data is in the grid, it must be organized to reflect your true cost structure.
- Separate fixed costs like rent and loan payments from variable expenses such as your material cost per kilogram.
- Standardize multi-currency data. Use quick Python scripts or standard formulas right in the grid to convert fixed costs in euros into your local currency.
- Adapt the categorization to your specific production methods, whether you are running traditional machining or conducting an additive manufacturing cost analysis.
Step 3: Bridging the gap of incomplete sales data
Incomplete data is a constant challenge for operations analysts. If your main sales data has missing gaps, traditional spreadsheets will simply return errors.
- Leverage Quadratic’s native SQL capabilities to join partial sales tables with your comprehensive production cost tables.
- Use Python pandas within the spreadsheet to extrapolate missing values or filter out incomplete rows cleanly.
- Maintain an accurate, high level view of profitability without letting a few missing sales records derail the entire analysis.
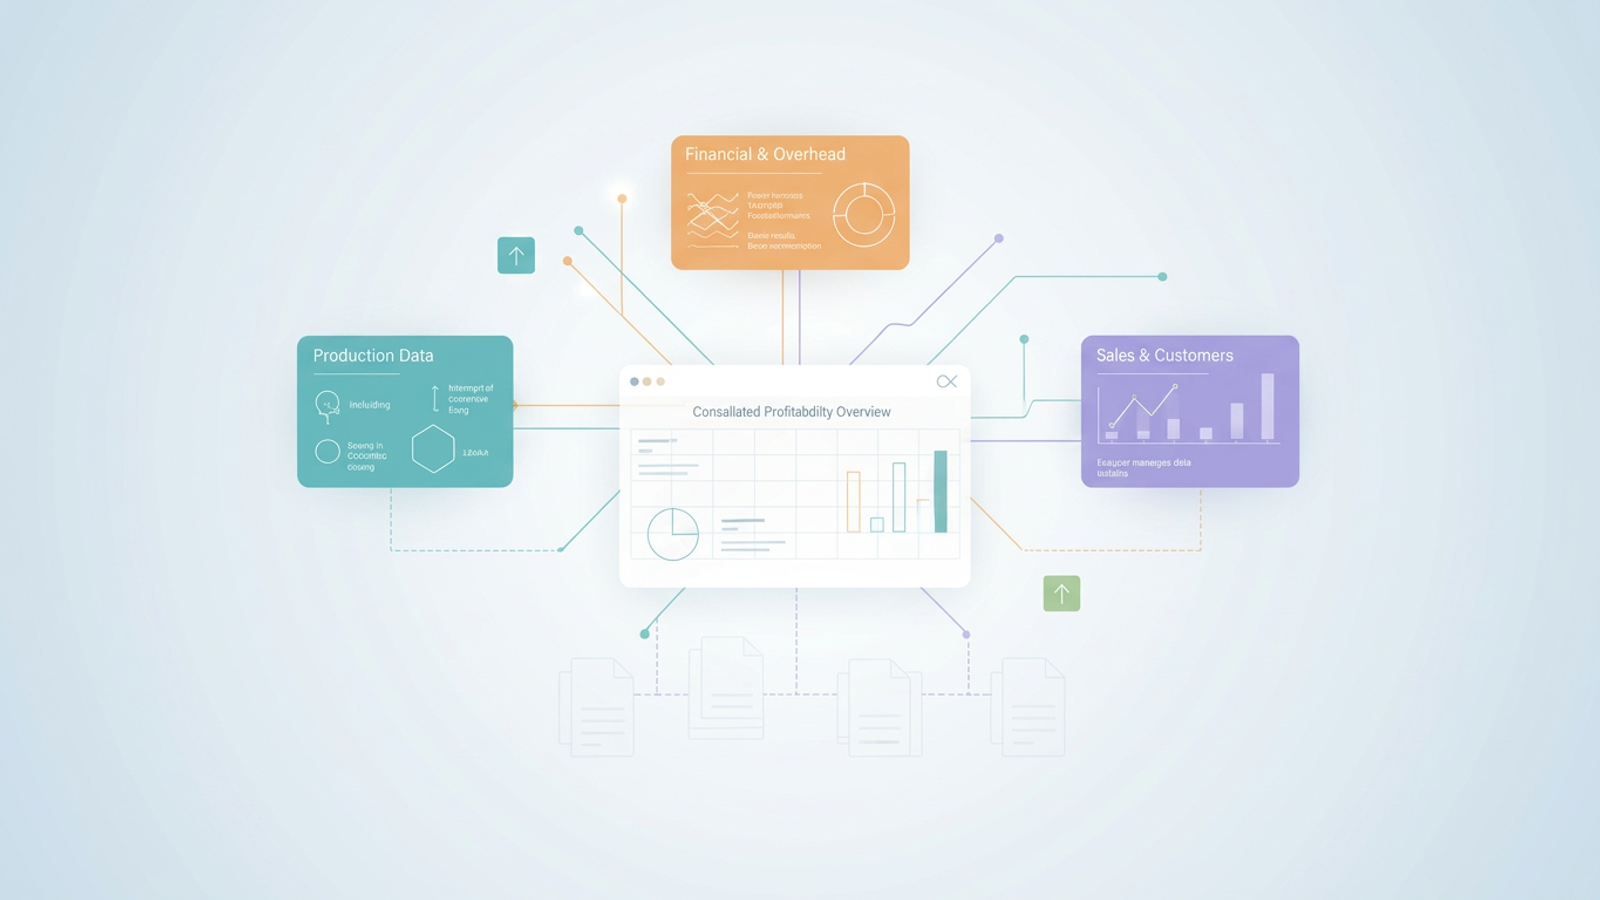
Step 4: Consolidating metrics into a structured analysis table
The final step is merging these disparate tables into a cohesive financial overview for business leaders.
- Combine the cleaned PDF data, the standardized currency tables, and the merged sales data into a single master view.
- Generate a structured analysis table that provides internal stakeholders with a clear breakdown of all cost components.
- Keep the logic and outputs in one place so the team can collaborate in real time and make informed operational decisions.
Key profitability metrics to track in your consolidated dashboard
With your messy data finally clean and consolidated in Quadratic, you can focus on the manufacturing profitability metrics that actually matter. A well structured dashboard should highlight the key performance indicators that drive your business forward.
Track your unit contribution margin to understand exactly how much profit each item generates after accounting for accurate material and production costs. Monitor your operating profit margin to see the impact of your fixed and variable expenses on your bottom line. Finally, keep a close eye on your total overhead ratio to ensure that rent, utilities, and factoring fees are not quietly eroding your profitability.
Upgrade your manufacturing cost analysis workflow
Uncovering true profitability requires looking past textbook formulas and rigid templates. The reality of manufacturing finance involves scattered tables, static PDFs, multiple currencies, and incomplete records.
To master cost analysis manufacturing, you need tools designed for the modern data landscape. Quadratic empowers you to consolidate your fragmented data, automate complex transformations with SQL and Python, and build a single source of financial truth. By embracing a dynamic AI spreadsheet, you can stop fighting with manual data entry and start delivering the operational insights your business needs to thrive.
Use Quadratic to Automate Manufacturing Cost Analysis
- Consolidate all manufacturing cost data: Directly import expenses from static PDFs, integrate production costs from CSVs, and connect to live databases, eliminating manual data entry for a complete financial picture.
- Automate complex calculations with Python and SQL: Clean, categorize, and convert multi-currency costs in real-time within the spreadsheet, moving beyond brittle formulas for accurate fixed, variable, and material cost analysis.
- Bridge gaps in incomplete sales and production records: Use native SQL and Python pandas to join partial sales data with full cost tables, extrapolate missing values, and maintain precise profitability metrics like unit contribution margin.
- Generate comprehensive profitability dashboards: Combine all cleaned data into a single, collaborative grid, providing financial managers and operations analysts with a clear overview of unit contribution, operating profit, and total overhead ratios.
Ready to see how easy it is to unify your data and gain insights? Try Quadratic