
Table of contents
- The strategic importance of a sales volume forecast
- Common sales volume forecasting methods
- The broken FP&A workflow: why traditional tools fall short
- Step-by-step: how to forecast sales volume in a dynamic dashboard
- Bridging the gap between raw data and strategic planning
- Conclusion
- Use Quadratic to forecast sales volume
Accurately forecasting sales volume is critical for strategic planning. Financial analysts and FP&A professionals often find themselves wasting time jumping between SQL databases, static spreadsheets, and heavy BI tools. To truly forecast sales volume with precision, you need a dynamic, single source of truth. A unified workspace that handles data ingestion, calculation, and visualization in one place changes the game, allowing you to turn raw multi-channel data into actionable insights without the usual friction.
The strategic importance of a sales volume forecast
A reliable sales volume forecast does more than just predict future revenue. It aligns ambitious revenue goals with ground-level operational reality. When you analyze a forecast sales volume and sales budget together, you give leadership the clarity needed to allocate resources effectively.
Furthermore, the downstream effects on the supply chain are massive. A precise sales forecast and modeling of production volumes across different warehouses and countries ensures that inventory meets demand without overstocking, a core tenet of modern predictive inventory management. By understanding exactly what products are moving and where, teams can protect profit margins and optimize their global footprint.
Common sales volume forecasting methods
To improve their overall financial data analytics, analysts typically rely on a few proven forecasting approaches—often bolstered by Python-based financial analysis—to build their models. When forecasting sales volume, analysts typically rely on a few proven approaches to build their models.
Historical forecasting relies on past multi-channel data to predict future performance, establishing a reliable baseline. Bottom-up versus top-down modeling offers two different perspectives. A bottom-up approach builds projections from the product division level up to the total market, while a top-down approach starts at the macro market level and filters down to individual regions; understanding the trade-offs of both is essential for effective top-down and bottom-up planning.
Finally, scenario planning, or what-if analysis, involves stress-testing forecasts against market volatility to see how different variables impact the bottom line, demonstrating the distinct but complementary roles of financial modeling and scenario planning.
The broken FP&A workflow: why traditional tools fall short
In traditional FP&A modeling, the typical workflow is highly fragmented. The typical workflow is highly fragmented. You might pull warehouse or regional data using SQL, export it as a CSV into a traditional spreadsheet to calculate year-over-year growth, and then wrestle with complex BI software to build a presentation-ready dashboard.
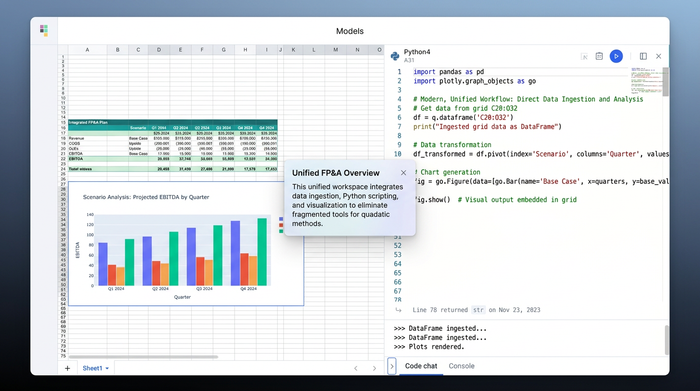
This rigid separation of tools creates bottlenecks and static data silos. As a modern Python spreadsheet, Quadratic combines SQL and Python data pulls, traditional spreadsheet formulas, and instant dashboarding in a single browser-based canvas. As an AI-powered spreadsheet, Quadratic combines SQL and Python data pulls, traditional spreadsheet formulas, and instant dashboarding in a single browser-based canvas.
Step-by-step: how to forecast sales volume in a dynamic dashboard
Building a dynamic dashboard for multi-channel, multi-region sales data doesn't have to be a disjointed process. Here is how a financial analyst can build a unified forecasting workflow inside Quadratic.
Step 1: ingest and cleanse multi-region data
The first step is getting your raw data into the workspace. In Quadratic, you can use SQL or Python directly within the spreadsheet grid to pull live sales data from various warehouses, countries, and market channels. This eliminates the need for messy CSV dumps. Your data remains live and connected to the source, ensuring your analysis is always based on the most current information.
Step 2: calculate YoY growth and core KPIs
Once the data is ingested, you need to establish your baseline metrics. Using familiar spreadsheet formulas right next to your SQL pulls, you can quickly calculate year-over-year and year-to-date growth. You can easily break down historical versus projected sales volumes, comparing brand performance and specific product division metrics. This provides the mathematical foundation needed for accurate projections.
Step 3: build the sales forecast and what-if scenarios
By starting with a financial forecast template, you can leverage Quadratic's robust formula capabilities to create dynamic projections based on historical data. Using Quadratic's robust formula capabilities, you can create dynamic projections based on historical data. By setting up what-if scenarios, you can adjust variables like seasonal demand or regional market shifts to see how they impact your overall projections in real time.
Step 4: visualize with dynamic filtering
Finally, you can turn your grid data into a dynamic dashboard without leaving the spreadsheet. Quadratic allows you to add filters for location, channel, and product division. Analysts can instantly visualize breakdowns and key performance indicators, providing stakeholders with a clear, interactive view of the data without needing to export to a separate visualization tool.
Bridging the gap between raw data and strategic planning
A dynamic dashboard is more than just a reporting tool. It is a collaborative workspace that empowers cross-functional teams. When data ingestion, calculation, and visualization live in one place, sales operations and production teams can use this single source of truth to adjust production volumes and sales budgets in real time. Real-time multiplayer collaboration means finance, marketing, and operations can work together on the same analysis, keeping logic and context unified.
Conclusion
To accurately forecast sales volume, financial analysts need agility, accuracy, and unified tools. Relying on disconnected databases, static spreadsheets, and heavy visualization software only slows down strategic planning. Quadratic eliminates the friction between data ingestion, calculation, and visualization, allowing you to move from raw numbers to actionable insights faster. Try Quadratic today to build your own dynamic sales forecasting dashboards and transform the way your team makes data-driven decisions.
Use Quadratic to forecast sales volume
- Connect directly to live databases: Pull multi-channel and multi-region sales data using SQL or Python directly inside the grid, eliminating manual CSV exports and static data silos.
- Combine formulas and code: Calculate YoY growth, track key performance indicators, and build bottom-up models using standard spreadsheet formulas right next to your data queries.
- Run advanced what-if scenarios: Leverage Python on the same canvas to stress-test your projections against supply chain constraints, seasonal demand, and market shifts.
- Build interactive dashboards: Create visual reports with dynamic filters for location, channel, and product division without needing to export to heavy BI software.
- Align cross-functional teams: Work in a real-time collaborative workspace so finance, sales operations, and production teams can adjust budgets and production volumes in sync.
Streamline your planning workflow and build dynamic, connected dashboards in a single workspace. Try Quadratic