
Table of contents
- What is incentive compensation calculation?
- The core formulas behind calculating incentive compensation plans
- A real workflow: building an incentive compensation plan calculator in Quadratic
- Common mistakes in incentive compensation calculation
- Spreadsheets vs. dedicated compensation software vs. Quadratic
- FAQs
- Bringing it together
- Use Quadratic for incentive compensation calculation
Variable pay is one of the highest-leverage tools that HR and finance teams own, directly influencing how variable pay plans are structured to drive organizational performance. Done well, it aligns individual behavior with company priorities, rewards top performers fairly, and gives leadership a clear lens into workforce performance. Done poorly, it creates disputes, erodes trust, and quietly burns through budget.
And yet, despite how strategic it is, most teams still handle incentive compensation calculation in a patchwork of fragmented spreadsheets stitched together from CRM exports, operations dashboards, finance reports, and engagement tools. The math itself is rarely the hard part. The hard part is wrangling the data, applying rules consistently, and producing something that aligns with standard compensation committee guidelines while remaining easy to read.
Teams usually face a frustrating choice: spreadsheet chaos on one side, or rigid HR compensation software on the other. Neither serves the analyst who needs flexibility and data integrity at the same time.
This guide walks through a complete, data-driven approach to incentive compensation calculation, from raw data aggregation to a polished, color-coded payout report. We'll use a real workflow from an HR and finance lead at a service organization, built end to end in Quadratic.
What is incentive compensation calculation?
Incentive compensation calculation is the process of translating individual performance against defined KPIs into variable pay. It sits in the middle of a total rewards package, between fixed base salary and longer-term benefits, and it's the lever organizations pull to reward outcomes rather than tenure or title.
Operational and service-based organizations tend to rely on incentive pay more heavily than their peers because performance is multi-dimensional. A field technician, account manager, or service representative may be measured on service delivery volume, revenue contribution, customer engagement, and day-to-day activity levels all at once. Each metric tells part of the story, and the compensation plan has to combine them fairly, often aligning with a broader compensation analysis template to ensure overall market equity.
Common incentive structures
Most plans fall into one of a few patterns:
- Flat commission, where payouts scale linearly with a single metric like revenue.
- Tiered payouts, where achievement bands trigger different payout rates.
- Threshold or gate-based bonuses, where employees must clear a minimum bar before any payout applies.
- MBO and KPI-weighted plans, where multiple objectives are combined into a composite score.
In practice, real plans are hybrids. A service team might use a threshold gate on quality, tiered payout structures on volume, and a weighted KPI score across engagement and revenue. That complexity is exactly why the calculation step matters, and why forward-looking teams use a monte carlo simulation template to stress-test their models and forecast payout scenarios before launch.
The core formulas behind calculating incentive compensation plans
Before getting into tooling, it helps to anchor on the math. Calculating incentive compensation plans almost always reduces to three building blocks:
- Target Achievement % = Actual Performance ÷ Target
- Payout % = a function of achievement (linear, tiered, or accelerated)
- Final Incentive = Target Incentive × Payout % × Weighting
Here's a small worked example for a service representative with a $4,000 quarterly target incentive split across two KPIs:
| KPI | Weight | Target | Actual | Achievement % | Payout % | Weighted payout |
|---|---|---|---|---|---|---|
| Service volume | 60% | 500 | 540 | 108% | 115% | $2,760 |
| Revenue contribution | 40% | $80,000 | $72,000 | 90% | 80% | $1,280 |
| Total | $4,040 |
The arithmetic is simple. What makes it hard in the real world is everything around it.
Why formulas alone aren't enough
Plans don't break because the formulas are wrong. They break because the inputs are scattered. Service volume lives in an operations database. Revenue lives in a finance export. App engagement and activity metrics live in yet another system. Trying to manually connect spreadsheets in excel with VLOOKUPs, copy-paste, and one-off CSV downloads is exactly how the "manual errors" that competitors warn about creep in.
This is where the workflow itself matters more than the formula. The rest of this guide focuses on building that workflow once, in one place.
A real workflow: building an incentive compensation plan calculator in Quadratic
Consider an HR and finance lead at a service-based organization. Their team is measured on four metrics: service delivery volume, revenue contribution, application engagement, and activity levels. Each metric lives in a different system. Each quarter, they need to produce a defensible payout report that leadership can review and sign off on.
Here's how they build an incentive compensation plan calculator in Quadratic, end to end.
Step 1: consolidating performance data from multiple sources
The first and most underrated step is data consolidation. Most tutorials assume you already have a clean performance table. You almost never do.
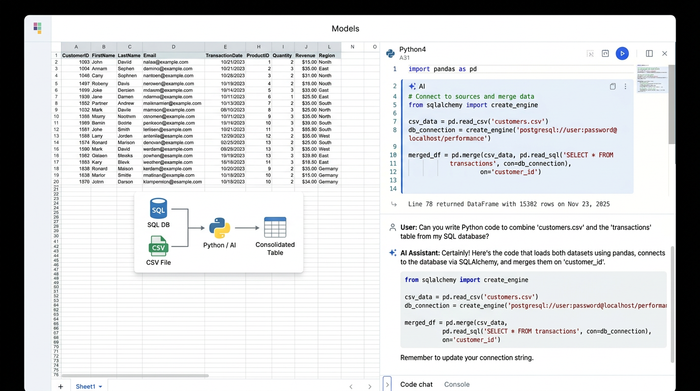
In Quadratic, the user pulls each source directly into the same canvas:
- Service volume data flows in from the operations database through a SQL connection.
- Revenue contribution comes from a finance export, imported as a CSV or pulled from an API.
- App engagement and activity metrics are loaded from a separate analytics source.
Because Quadratic functions as a Python spreadsheet that supports Python, SQL, and formulas natively in the same grid, the user can join those sources on employee ID without exporting anything to a third tool. A short Python cell merges the four datasets into a single performance summary table, keyed by employee. Using an AI spreadsheet analyzer, AI assistance can scaffold that join logic from a plain-language prompt, which is especially useful when the source files have inconsistent column names or formats.
The outcome is a clean, unified table: one row per employee, one column per KPI, ready for calculation. No file shuffling, no version conflicts.
Step 2: applying business rules and performance thresholds
With the data consolidated, the next step is encoding the plan rules.
The user defines target values for each KPI in a small reference table, which keeps the assumptions visible and easy to update. From there, formulas compute achievement percentages for each metric: actual divided by target, with guardrails for missing or zero values.
Each KPI is then assigned a weight that reflects its strategic importance, following structured KPI scorecard weighting methodologies to ensure balanced evaluation. A weighted average produces a composite performance score per employee, and a lookup against a payout schedule maps that score to a payout tier. For teams that prefer to skip writing the lookup logic by hand, Quadratic's AI can generate the formula or Python snippet directly from a description of the tier structure.
Because everything sits in one canvas, changing a target, a weight, or a tier threshold instantly recalculates downstream payouts. That's a meaningful difference from rigid HR software, where rule changes often require a vendor ticket.
Step 3: calculating final incentive payouts
Now the math gets applied at the employee level. For each row, the user multiplies the target incentive by the payout percentage to get a preliminary payout. Caps, floors, and accelerators are layered in next: a maximum payout cap protects the budget, a floor ensures employees who barely missed target still get something meaningful, and an accelerator rewards over-performance above a certain threshold.
Arithmetic rounding is applied consistently so that every payout figure is clean to the nearest dollar (or whatever convention the organization uses). Currency and percentage formatting are applied across the relevant columns so the report reads naturally. These small details matter when the document is going to a compensation committee or a CFO.
Step 4: conditional highlighting for transparent reporting
A payout report that's just numbers is hard to scan. The user adds conditional formatting to make performance visible at a glance:
- Green for employees exceeding target.
- Yellow for on-target or near-target performers.
- Red for anyone under threshold who didn't trigger a payout.
The same color logic is applied across each KPI column, not just the final payout, so reviewers can immediately see where each person is strong or weak. During the compensation review meeting, this visual layer turns what used to be spreadsheet archaeology into a five-minute walkthrough. Decisions get made faster, and conversations focus on edge cases rather than on parsing rows of unformatted numbers.
Step 5: sharing the final payout dashboard
The final step is distribution. Instead of emailing a static Excel file that will be out of date within an hour, the user shares the Quadratic canvas directly with finance, HR leadership, and the relevant managers. Because the data connections are live, the next quarter's run isn't a rebuild. It's a refresh.
Comments and edits happen in real time on the same sheet, which removes the usual back-and-forth of "v3_final_FINAL.xlsx" versions. Logic, inputs, and outputs all stay together in one place, which is also useful for audit trails when leadership asks how a number was calculated months later.
Common mistakes in incentive compensation calculation
Even with a solid plan design, the calculation step is where most teams stumble. The recurring offenders:
- Calculating off stale or partial data, because the export was pulled days before the cutoff.
- Overcomplicating tier structures to the point where employees can't predict their own payout.
- Forgetting to round consistently, which produces awkward figures and erodes credibility.
- Manual copy-paste between source systems, which is the single largest source of error.
- No visual layer, so compensation reviews devolve into squinting at rows of raw numbers.
An integrated workspace eliminates most of these by design. Live connections keep data fresh. Formulas and code stay co-located with the data they operate on. Rounding and formatting are applied once and persist across refreshes. Conditional highlighting turns the final report into something a non-analyst can actually read.
Spreadsheets vs. dedicated compensation software vs. Quadratic
The choice many teams feel stuck between, traditional spreadsheets or dedicated compensation software, is a false binary. Here's how the three compare:
| Traditional spreadsheets | Dedicated comp software | Quadratic | |
|---|---|---|---|
| Flexibility | High | Low | High |
| Data integrity | Low | High | High |
| Native data connections | Limited | Moderate | Strong (SQL, APIs, Python) |
| Conditional formatting | Yes | Varies | Yes |
| AI assistance | Limited | Limited | Native |
| Learning curve | Low | High | Low |
Traditional spreadsheets give you flexibility but no real safeguards against bad data. Dedicated software gives you structure but locks you out of the kind of ad hoc analysis that compensation work actually requires. Quadratic is designed to bridge that gap: the flexibility of a spreadsheet, the data integrity of a database, and AI assistance for the heavier lifting.
FAQs
What is the formula for incentive compensation calculation?
The standard formula is: Final Incentive = Target Incentive × Payout % × Weighting. Payout % is derived from achievement against target, either linearly or through a tiered schedule. When multiple KPIs are involved, each is calculated separately and combined using its assigned weight.
How do you build an incentive compensation plan calculator without specialized software?
A modern spreadsheet that supports live data connections, formulas, and code in one place is enough. In Quadratic, for example, you can pull source data directly from operational databases and finance systems, apply your plan rules in formulas or Python, and visualize results with conditional formatting, all in one canvas.
What's the difference between commission and incentive compensation?
Commission is a specific type of incentive compensation, typically a percentage of revenue or sales. Incentive compensation is the broader category, covering commissions, bonuses, MBO payouts, and KPI-weighted plans across any role, not just sales.
How often should incentive payouts be calculated?
It depends on the plan, but most service and operational organizations run incentive calculations monthly or quarterly. Faster cycles tighten the feedback loop between performance and reward, but they also raise the bar for data quality and process consistency, as highlighted in historical studies on the effectiveness of variable pay collection.
How do I handle missing or messy performance data when calculating incentive compensation plans?
Address it at the source where possible, and document defaults for everything else. In practice, that means defining how to treat missing values (zero, prior period, or excluded), flagging anomalies before they hit the payout formula, and keeping the data cleaning steps visible alongside the calculation. AI-assisted cleaning in Quadratic can accelerate this, especially for inconsistent identifiers across systems.
Bringing it together
Effective incentive compensation calculation isn't really about the formula. The formula is the easy part. It's about unifying data from systems that were never designed to talk to each other, applying business rules consistently, and communicating the outcome in a way that leadership can trust and employees can understand.
The teams that do this well stop treating compensation runs as a quarterly fire drill and start treating them as a repeatable workflow. One canvas for ingestion, calculation, rounding, formatting, and visual reporting. One source of truth that gets refreshed instead of rebuilt.
If you're ready to move off fragmented spreadsheets without committing to rigid HR software, try Quadratic free and build your own incentive compensation plan calculator on top of your real data.
Use Quadratic for incentive compensation calculation
- Connect directly to live data: Pull operations data via SQL, finance exports via CSV, and activity metrics via APIs directly into a single canvas, eliminating manual CSV exports.
- Join disparate datasets with Python: Merge multiple performance metrics on employee ID using native Python cells right in the spreadsheet grid, avoiding fragile lookup formulas.
- Build dynamic payout structures: Define targets, weights, and tiered payout schedules in reference tables that instantly update final payouts when assumptions change.
- Leverage AI for complex logic: Use built-in AI to write lookup formulas, build tier structures, or clean inconsistent employee identifiers from different systems.
- Create visual review dashboards: Apply conditional formatting directly to the grid to highlight performance bands, making it easy for stakeholders to spot trends and outliers.
- Establish a repeatable workflow: Share a live, collaborative canvas with HR and finance leaders to review payouts in real time, then refresh the data next quarter instead of starting from scratch.
Ready to simplify your variable pay cycles? Connect your systems, build your model, and Try Quadratic
