James Amoo, Community Partner
May 26, 2026

Dropping AI into a spreadsheet has become trivial. Almost every modern spreadsheet tool now offers a chat box, a sidebar, or an add-on that promises to analyze your data with a prompt. The hard part is knowing whether that answer is right.
That gap between "AI gave me a number" and "I trust this number enough to make a decision" is where most evaluations of an AI spreadsheet analyzer should start. If you are a finance lead modeling next quarter's forecast, an analyst handing a chart to a stakeholder, or an operator trying to understand why a metric moved, the question is not whether using AI to analyze spreadsheet data is possible. It is. The real question is whether you can verify what it produced.
This article makes a simple argument: the best AI spreadsheet analyzer is the one that shows its work. We will look at what these tools actually do, why opaque outputs are risky, what an inspectable AI-generated analysis looks like in practice, and how to evaluate tools when you analyze a spreadsheet with AI in finance, ops, or analyst work.
What an AI spreadsheet analyzer actually does
An AI spreadsheet analyzer is a tool that lets users analyze spreadsheet data with AI through natural-language prompts, which the system translates into formulas, code, charts, or written summaries. Instead of writing a VLOOKUP or a pivot table by hand, you describe what you want, and the AI builds it.
These tools touch the full data analytics lifecycle: ingesting raw data, cleaning it, exploring patterns, building visualizations, and producing models or summaries. The category includes everything from chatbot overlays bolted onto traditional spreadsheets like Excel and Google Sheets to AI data analytics tools designed around AI from the start.
Quadratic combines AI spreadsheet analysis with a transparent and editable spreadsheet environment. Instead of hiding calculations behind a chatbot response, Quadratic generates formulas, Python, SQL, and charts directly inside the grid where users can review and refine them.
Can AI analyze spreadsheets reliably? The black-box problem
The black-box problem is straightforward. When an AI returns a number, a chart, or a sentence without exposing the calculation behind it, you have no way to validate the result. You are accepting the output on faith. For a quick exploratory question that may be acceptable. For anything that influences a decision, a forecast, or a financial report shared with someone else, it is not.
The failure mode is silently giving wrong answers that look plausible. AI models are good at producing confident outputs even when they have misinterpreted a column, joined the wrong tables, or applied the wrong aggregation. Ambiguous schemas are especially dangerous. If you have two columns that could both be called "revenue," the AI will pick one. If it picks the wrong one, the answer will still look correct.
This is the same concern that drives explainable AI conversations in healthcare, lending, and cybersecurity. In a spreadsheet context. The stakes are different, but the principle is the same: any decision-grade output needs to be auditable. An AI that can analyze spreadsheets without showing its reasoning is a productivity tool only when it happens to be right.
Python vs. formulas: when each one matters
A recurring question when people evaluate the best AI for analyzing spreadsheets is when a formula is enough and when you actually need code. The honest answer is that it depends on the work.
Formulas are the right tool for lookups, simple aggregations, conditional logic, and most cell-level calculations, and a good AI formula generator makes producing them fast and easy to audit at a glance.
Python is a better fit when you need to clean messy data, do statistical work, join across multiple tables, parse strings or dates with non-trivial logic, or build a data transformation you want to reuse. Anything that would require a tortured nested formula is usually clearer and more reliable as a few lines of Python.
SQL for data analytics belongs in the same conversation when your data lives in a database or in flat files large enough that loading the whole thing into a spreadsheet is impractical. A query that filters and aggregates at the source is often the simplest, most transparent way to get the slice you need.
A capable AI spreadsheet analyzer should generate the right tool for each job and let you see and edit whichever it chooses. Locking users into formulas only or hiding code behind a chat interface limits both the analysis and the ability to verify it.
Quadratic: the best AI spreadsheet analyzer
Quadratic is built on the show-your-work principle. When Quadratic AI generates a formula, a Python block, or a chart, the underlying expression or code is written into the spreadsheet cell and remains visible and editable. You are not accepting an answer on faith. You can read what the AI produced, understand it, and verify it against your own knowledge of the data. Let’s explore the features of Quadratic.
Connect live data sources instead of analyzing static snapshots
Traditional spreadsheet analyzers often operate on frozen uploads. Quadratic treats live data as part of the analytical workflow itself. Users can connect directly to APIs, databases, and financial data sources, allowing spreadsheets to continuously refresh as new information arrives.
For finance teams, this means market data, forecasts, and reporting dashboards can stay synchronized with live systems while remaining completely inspectable.
Use Python and SQL for advanced spreadsheet analysis
Quadratic combines Python and SQL in one browser-based workspace, making it possible to move beyond traditional spreadsheet limitations without building separate engineering pipelines.
You can use native Python to clean messy datasets, run statistical models, or automate repetitive transformations directly in the grid. SQL can query connected databases inline, while spreadsheet formulas continue handling lightweight calculations and references.
This structure is particularly powerful for financial data analysis, operational reporting, and large-scale spreadsheet auditing. Analysts can move from data processing to transformation to visualization without exporting data between disconnected tools.
Generate AI-powered analysis with visible formulas and code
Most AI spreadsheet analyzers stop at generating answers. Quadratic goes further by exposing the actual logic behind every generated output. When the AI creates a formula, Python script, SQL query, or chart, the underlying logic remains fully visible and editable in the grid.
This fundamentally changes how teams interact with AI-generated analysis. Instead of asking users to trust opaque outputs, Quadratic allows analysts to inspect every transformation, validate assumptions, and refine calculations directly. A complex categorization workflow can remain in formulas, while larger multi-step transformations can shift into Python without leaving the spreadsheet environment.
Let’s see how this works using a sample dataset:
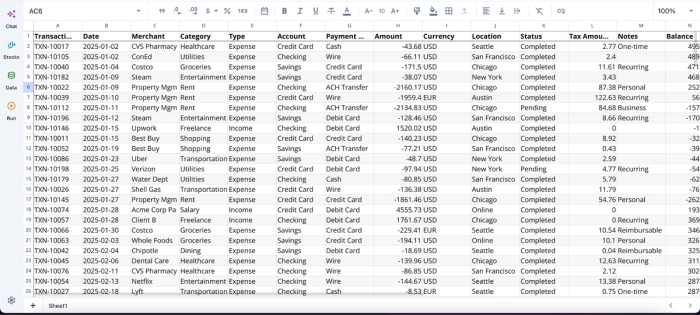
Once you have our data in the grid (either by import or direct connection), you can immediately begin analyzing:
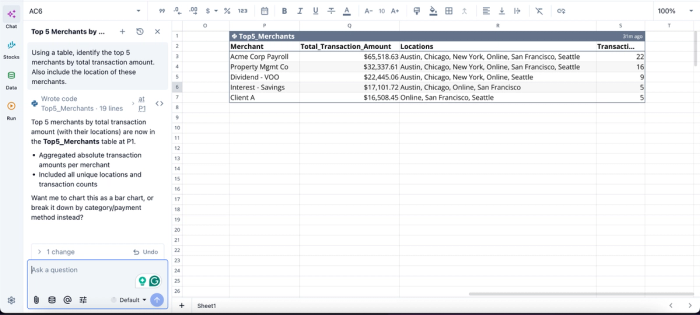
In this image, I prompt Quadratic AI, “Using a table, identify the top 5 merchants by total transaction amount. Also include the location of these merchants.” It instantly generates a table that shows the top 5 merchants, including the total transaction amount, locations, and number of transactions.
Turn AI summaries into interactive visual analysis
Quadratic extends beyond text-based AI explanations by integrating visual analysis directly into the workflow. Users can prompt AI to generate charts, trend summaries, and dashboard layouts directly from the underlying spreadsheet data.
The visualizations live beside the formulas, Python logic, and source tables, so teams can immediately verify how a chart was produced and whether the underlying assumptions are correct. This eliminates one of the biggest weaknesses of traditional dashboard tooling: disconnected visual layers that hide the transformation logic underneath.
Here’s an example:
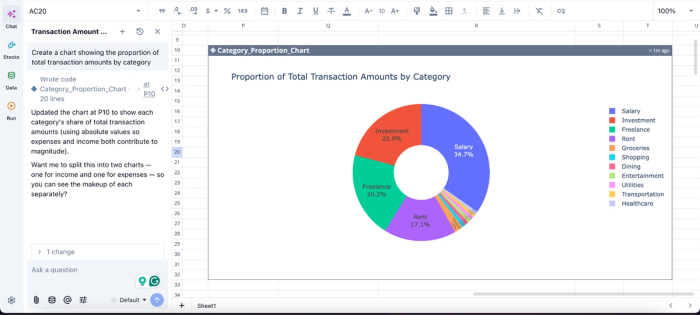
In this image, I ask Quadratic AI to “Create a chart showing the proportion of total transaction amounts by category.” In seconds, it creates a pie chart that displays the total transaction amounts by category. Users do not need to write complex code or export to external BI tools; Quadratic AI creates dynamic and highly interactive visualizations from simple text prompts.
Collaborate on AI-generated workflows without losing context
One of the largest problems with AI spreadsheet tooling is that explanations often disappear into private chat panels or temporary prompts. Quadratic solves this by keeping the AI-generated formulas and visualizations directly inside the shared spreadsheet workspace.
Teams can review the same analysis together, inspect the exact formulas and Python scripts being used, and collaboratively refine workflows in real time. Anyone opening the file later can see how the analysis was constructed and how the outputs were generated.
Conclusion and CTA
Adding AI to a spreadsheet is the easy part. Trusting the output is the hard part. The teams that get the most value from AI-assisted analysis are the ones that insist on seeing the underlying formula, Python, or SQL, not just the answer. Transparency is the basis of trust, and it is what separates a useful AI spreadsheet analyzer from a risky one.
Quadratic allows you to upload your spreadsheet into a familiar environment, then use AI to analyze, chart, and summarize the data in a workflow you can actually inspect. Try Quadratic for free.
Frequently asked questions (FAQs)
What is the best AI for analyzing spreadsheets?
The best AI for analyzing spreadsheets is one whose outputs you can read, edit, and audit. A polished chat interface does not make up for hidden logic. Look for tools that let you treat AI-generated analysis the same way you would treat a colleague's work: by reading what they did and verifying it.
How does Quadratic help when you analyze spreadsheet data with AI?
Quadratic writes formulas, Python, or SQL directly into the spreadsheet cell, so the logic remains visible and editable. Unlike chatbot overlays that hide reasoning in a sidebar, Quadratic's approach keeps the analysis in the workspace where it can be reviewed and audited by anyone who opens the file. This makes it possible to actually trust the output.
Do I need to know Python to use an AI spreadsheet analyzer?
No. But a tool that can generate Python when needed and let you read it is more powerful than one limited to formulas or chat replies. You do not need to write the code yourself. You just need to be able to inspect what the AI wrote so you can verify it is correct.
