
James Amoo, Community Partner
May 26, 2026

Picture the analyst with twelve monthly sales files sitting in a shared folder, a master customer list in another workbook, and a regional tab structure that keeps mutating every quarter. Connecting that data the first time is rarely the hard part. The hard part is what happens three months later when someone renames a file, a colleague adds a new column, or the workbook takes 40 seconds to open.
Most tutorials on connecting spreadsheets in Excel stop at the click-path. They show you how to paste a link or write a VLOOKUP and call it done. What they skip is the data analytics lifecycle: how those connections behave when files move, schemas drift, and data volumes grow. That gap is where workflows quietly break.
This guide walks the full arc. We will cover the main methods to connect spreadsheets in Excel, where each one tends to fall apart under real-world conditions, how to prepare your data so joins survive change, and how Quadratic offers a multi-spreadsheet workflow that scales without becoming a maintenance burden.
How spreadsheet connections work in Excel
Under the hood, Excel offers a handful of distinct mechanisms for pulling data from one place into another. Cell references point to specific addresses. External links extend those references across files. Lookup formulas match values by key. Power Query loads data through a defined import and data transformation step. Each method has a different tolerance for change.
It helps to keep two distinctions in mind when thinking about how to connect spreadsheets in Excel.
The first is within-workbook versus cross-workbook. A reference to another tab in the same file is comparatively safe because the tab travels with the workbook. A reference that reaches into a separate file introduces a dependency on file paths and naming conventions, and either can break.
The second is summarizing versus appending. Summarizing means aggregating values from multiple sources into a single number or pivot, like rolling up regional totals. Appending means stacking records together to create a longer table, like combining twelve monthly transaction logs into one. Different methods are better suited to each.
Quadratic changes the workflow significantly. Instead of relying on brittle file-path links between disconnected spreadsheets, Quadratic allows users to connect directly to live databases, APIs, CSVs, and external data sources inside one browser-based workspace. Data ingestion, transformation, formulas, Python scripts, and visualizations all live in the same grid, reducing the risk of broken external references and fragmented logic.
How to connect two spreadsheets in Excel
There are five common methods for connecting two spreadsheets in Excel: cell references and Paste Link, lookup formulas like VLOOKUP and INDEX-MATCH, the Consolidate tool, Power Query, and modern dynamic array functions. Each one has a niche. Choosing well, especially when you need to connect 2 spreadsheets in Excel that will keep changing, depends on understanding how each behaves over time.
Cell references and Paste Link (within and across workbooks)
The simplest connection is a direct cell reference. Within a workbook, =Sheet2!B4 pulls a value from another tab. Across workbooks, the syntax becomes something like ='[SalesQ1.xlsx]Summary'!B4, and Paste Link offers a menu-driven shortcut for the same idea.
The advantage is immediacy. There is nothing to configure, and updates propagate automatically as long as both files are open. The disadvantage is fragility: external links are tied to file paths. Move the source file, rename it, or send the workbook to a colleague whose folder structure differs from yours, and the link breaks. For ad hoc one-time work, this is fine. For anything recurring, it is a liability.
VLOOKUP and INDEX-MATCH for joining by key
Lookup formulas are how most analysts handle joins. A common scenario is figuring out how to connect an invoice and spreadsheet in Excel, where each invoice line item needs to be matched to a master product or customer record by ID. VLOOKUP and INDEX-MATCH both perform that job.
The catch is durability. VLOOKUP refers to columns by position, so if someone inserts a new column in the master sheet, every formula silently returns the wrong value. INDEX-MATCH refers to columns by their actual reference, which makes it noticeably more resilient when source data is reorganized. If you write lookups that will outlive the day you wrote them, prefer INDEX-MATCH or XLOOKUP.
Consolidate for summarizing across sheets
The Consolidate feature, found under the Data tab, aggregates values from sheets that share a similar structure, though analysts who rely on it for summaries often run into the same category of pivot table troubleshooting issues that arise when source data labels change unexpectedly.
Its weakness is exactly that dependency. Consolidate matches by label text, so if one sheet uses "Revenue" and another uses "Total Revenue," the rollup quietly drops a row. Add a new category to one sheet and not the others, and the result is incomplete in ways that are easy to miss.
Power Query for repeatable connections and appends
Power Query is the most scalable native option for connecting spreadsheets in Excel, and it is also the most practical native approach when you need to combine multiple Excel files into one without rebuilding the process each time. Instead of hardcoded references, it defines an import where the data lives, what data transformations to apply, and how to load the result. You can point it at a folder of files and have it append every workbook inside, or merge two queries on a key column the way you would in SQL for data analytics.
Power Query also addresses the maintenance problem more directly. Once a query is defined, you can refresh it on demand or set it to run automatically. To automatically refresh all connections in Excel spreadsheet, go to Data → Queries & Connections, open the connection properties, and enable "Refresh data when opening the file" or set a periodic refresh interval. This is the closest Excel gets to a true repeatable pipeline.
VSTACK and modern dynamic array functions
For users on recent versions of Excel, VSTACK and HSTACK provide a lightweight way to combine ranges within a workbook. VSTACK takes multiple arrays and stacks them vertically into one, which is handy for quick appends across tabs without setting up a full query.
The limits are real: these functions require Microsoft 365 or recent Excel versions, and they work best within a single workbook on ranges of modest size. They are not a substitute for Power Query when you need to pull from multiple files or apply transformations along the way.
Where Excel connections break down
This is the section most tutorials skip. Connecting two spreadsheets in Excel for the first time is straightforward. Keeping those connections working over weeks and months is where the real work begins.
Broken file paths and moved files
External links are the most common source of breakage. The link encodes a specific file path, and any change to that path breaks the reference. Files get moved into archive folders. Network drives get remapped. Workbooks get emailed to a teammate whose directory structure does not match yours. In every case, the receiving workbook opens to a forest of #REF! errors or stale data.
Schema drift: when source data changes shape
Schema drift is the slow accumulation of changes in source data: a new column inserted in the middle of a table, a header renamed from "Customer" to "Customer Name," a date field that starts arriving as text instead of a date.
VLOOKUP and Consolidate are particularly vulnerable. VLOOKUP's column-index argument silently points at the wrong field after an insertion. Consolidate stops aggregating a category when its label changes. Neither raises an error. The numbers just become quietly wrong, which is the worst possible failure mode.
Performance ceilings as data grows
Even when nothing is technically broken, scale becomes its own problem. Workbooks with thousands of cross-sheet formulas slow to a crawl during recalculation. File sizes balloon when external links pull in large ranges. Cross-workbook references compound the issue because Excel has to resolve each one. At some point, the spreadsheet that worked fine last quarter is taking a minute to open and several seconds to respond to every edit.
Building a multi-spreadsheet workflow with Quadratic
For analysts who have outgrown Excel's linking model and are looking for an alternative to Excel but want to stay in a spreadsheet environment, Quadratic is designed to remove the friction points that make multi-file Excel workflows fragile. Let’s see how Quadratic helps to streamline multi-spreadsheet analysis:
Join data from multiple operational systems into one live model
Most real-world spreadsheet workflows involve data from multiple systems. Sales data may come from a CRM export, financial metrics from accounting dashboards, marketing performance from an analytics platform, and operational KPI tracking from CSV uploads or APIs.
Quadratic allows users to unify these datasets directly inside the spreadsheet environment. Through native integrations with databases, APIs, and imported spreadsheets, users can create joined analytical models without moving data across disconnected tools.
This is where the platform becomes more than a spreadsheet replacement. Analysts can connect live data sources and continuously refresh the analysis without rebuilding the workflow each cycle. Instead of manually recreating reports every month, teams can rerun the same structured process against updated inputs.
The result is a significantly more scalable reporting workflow. Logic, joins, calculations, and source connections remain attached to the model itself, reducing the operational risk that typically comes with multi-file Excel systems.
Consolidate fragmented spreadsheets into a single analytical workspace
Traditional Excel workflows tend to break down once analysis spans multiple files. Teams end up managing nested folder structures, brittle external links, duplicate exports, and inconsistent spreadsheet versions shared over email or cloud drives. Quadratic approaches the problem differently by allowing users to bring multiple spreadsheets into a single browser-based canvas where the data outputs coexist in one environment.
Instead of maintaining fragile cross-workbook references, analysts can import operational exports, finance reports, or forecasting models directly into the same workspace and work with them side by side. The workflow becomes substantially easier to maintain, especially when recurring monthly or quarterly updates are involved.
This structure is particularly useful for organizations consolidating reporting across departments. Rather than stitching together disconnected spreadsheets every reporting cycle, teams can centralize the workflow into one reusable analytical layer that remains inspectable and repeatable over time.
Reconcile mismatched schemas with formulas, Python, and AI
One of the hardest parts of connecting spreadsheets is not the connection itself, but the inconsistency between files. Different naming conventions, missing fields, and inconsistent category labels create friction before meaningful analysis can even begin.
Quadratic streamlines the data cleaning process by combining spreadsheet formulas, native Python execution, and AI-assisted transformations in the same grid. Users can handle lightweight alignment tasks with formulas or use Python and SQL to normalize column structures and clean large datasets.
AI further accelerates this process by helping identify structural inconsistencies and summarizing data quality issues before the merge even occurs. Instead of manually hunting for formatting mismatches across tabs, users can quickly diagnose and repair data integration problems in context.
Use AI to summarize trends and identify inconsistencies across files
Once multiple spreadsheets are unified, the next challenge becomes interpretation. Large consolidated workbooks often contain anomalies or conflicting metrics that are difficult to identify manually.
Quadratic's AI capabilities help transform connected spreadsheets into interpretable analytical systems. Users can prompt AI directly in the sheet to summarize changes between reporting periods, flag inconsistent records, or explain the relationships between datasets.
For example, after combining monthly operational reports, users can ask AI to identify which departments experienced abnormal cost increases, which categories contain conflicting labels, or which metrics diverge significantly from historical patterns. Quadratic AI operates directly on the live spreadsheet data, so the outputs remain grounded in the actual structure of the workbook rather than detached from context.
Here’s an example in Quadratic:
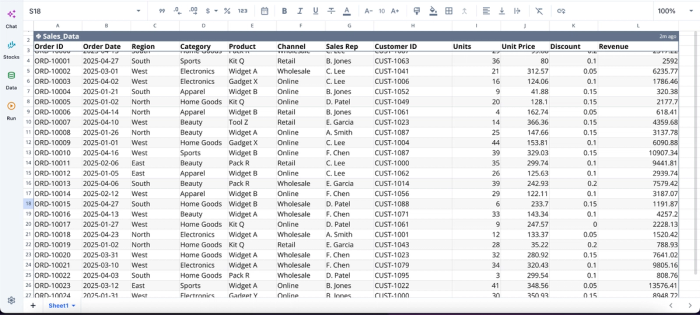
Once we have our data in Quadratic, we can immediately get into analysis:
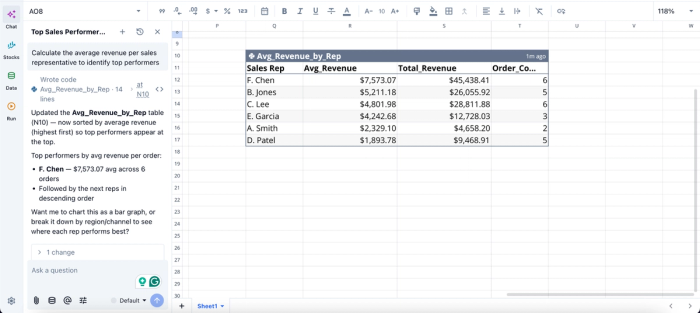
In this image, I ask Quadratic AI to “Calculate the average revenue per sales representative to identify top performers.” It instantly generates a table that shows the average revenue per representative, including the total revenue and order count for each sales rep.
Build dashboards directly on top of connected spreadsheets
In traditional workflows, connected spreadsheets are often just intermediate artifacts before the data gets pushed into another dashboarding platform. Quadratic eliminates that handoff by allowing users to build different charts, summaries, and dashboards directly on top of the connected data inside the same workspace.
Users can generate visualizations with formulas, Python plotting libraries, or AI-assisted chart generation directly in the grid. Revenue rollups, operational KPIs, financial summaries, inventory trends, and variance analyses can all update dynamically as the underlying spreadsheets refresh.
The visual layer stays connected to the transformation logic and source data, which means dashboards remain auditable and transparent. Teams can trace a chart directly back to the imported spreadsheets and the calculations that produced the metric.
Here’s an example:
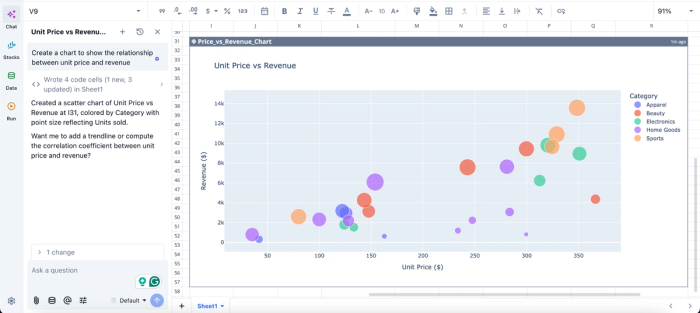
In this image, I ask Quadratic AI, “Create a chart to show the relationship between unit price and revenue.” It instantly creates a scatter plot that visualizes the relationship between the price and revenue.
Collaborate on a shared source of truth instead of passing files around
Multi-spreadsheet workflows become especially fragile when multiple stakeholders are involved. Different users edit different versions of the same workbook, external links break during file transfers, and institutional knowledge becomes trapped inside individual copies of spreadsheets.
Quadratic addresses this by making the workflow collaborative from the start. Teams work together inside a collaborative analytics platform where imported files, formulas, Python scripts, AI-generated summaries, charts, and dashboards remain synchronized in real time.
Instead of emailing linked spreadsheets back and forth, organizations maintain one shared analytical environment where everyone can inspect the transformation logic, validate assumptions, and contribute improvements collaboratively.
Conclusion and next step
We’ve discussed several legitimate ways to connect spreadsheets in Excel, from simple cell references to Power Query pipelines. But the choice between them is rarely about which one is easiest today. It is about which one survives the changes you know are coming: files moving, schemas drifting, data volumes growing, teammates joining the workflow.
Durability is what determines whether a multi-spreadsheet workflow scales. Change plan, make your prep steps visible and re-runnable, and pick a tool that matches how your data evolves rather than how it looks right now.
Quadratic streamlines this process by allowing users to bring multiple spreadsheets into an intuitive environment to build a cleaner and AI-powered workflow for combined analysis. Try Quadratic for free.
Frequently asked questions (FAQs)
What's the difference between connecting two spreadsheets and consolidating them?
Connecting typically means joining or referencing data so values flow between sheets, often by a shared key. Consolidating means aggregating values from multiple sources into a single summary, like totaling regional sales into a national figure. Use connections when you need row-level detail across files and consolidation when you need rolled-up totals from sheets with a similar structure.
Why do my Excel connections keep breaking?
The most common causes are moved or renamed source files, schema drift in the source data (new columns, renamed headers, changed types), and version mismatches when workbooks are shared across teams. The longer-term fix is to reduce cross-file dependencies, centralize your join logic, and make prep steps repeatable so changes are caught early rather than absorbed silently.
How does Quadratic help with connecting spreadsheets differently from Excel?
Quadratic removes the file-path fragility that makes Excel connections break. You import multiple spreadsheet files into a single canvas where there are no external links to break, and everything lives in one workspace. When a source file changes, you re-import or refresh in place, and you can use formulas or Python to align schemas, join data, and keep the entire workflow visible and re-runnable.
