Accurately tracking managed funds performance is critical for building stakeholder trust and driving strategic financial decisions. However, financial analysts and portfolio managers often fall into a common industry trap. They use one set of tools to clean and reconcile raw data and an entirely different set of tools to calculate metrics and report on performance. This disconnect creates friction, introduces errors, and slows down critical insights. The most effective way to evaluate performance is through a unified workflow that connects raw general ledger data directly to dynamic, presentation-ready dashboards, underscoring the benefits of a unified financial management approach.
The disconnect between reconciliation and reporting
When considering how to evaluate fund manager performance, the Global Investment Performance Standards (GIPS®) typically point to key performance indicators like return on investment, cumulative returns, and capital recovery. This level of scrutiny is especially high in the ongoing debate of actively managed funds vs index funds' performance. Active management demands rigorous, real-time financial data analytics to justify management fees and inform strategic pivots.
However, a major bottleneck exists in the real world. Before a financial professional can even think about building a pristine dashboard, they have to deal with massive data volumes, manual entry errors, and inconsistent formatting across profit and loss statements and general ledger transactions, contributing significantly to the true cost of poor data quality in financial operations. Reconciling this messy data, especially during critical month end reconciliation processes, often takes up the majority of an analyst's time, leaving little room for actual strategic analysis.
Bridging the gap: a unified workflow for capital fund management
To achieve true capital fund management performance, you need a system that brings data wrangling and metric calculation together. Consider the workflow of a real financial professional who needs to analyze multi-sheet portfolio data to manage performance across various segments.
By using Quadratic, this professional solves the silo problem entirely. Quadratic brings data ingestion, reconciliation, and metric calculation into a single, infinite spatial workspace. This eliminates the friction of moving data between disparate systems and keeps the entire analytical process in one secure location.
Step 1: ingesting and consolidating multi-sheet data
The first stage of the workflow involves pulling in all the necessary raw inputs. The financial professional imports investment summaries, profit and loss statements, product status reports, and raw general ledger transactions. In a traditional setup, these sources would live in disconnected workbooks that require constant toggling. In Quadratic, all these disparate sheets live on one infinite canvas. This allows the user to see the entire context of their financial data at a glance.
Step 2: the mechanics of financial data reconciliation
Next comes the messy middle step that most reporting tools ignore. The user must reconcile raw financial data with product status information. Because Quadratic supports native Python, SQL, and traditional formulas in the exact same grid, the user easily addresses complex data inconsistencies. They quickly fix type mismatches, such as converting text fields to proper date or currency formats. They also apply strict business rules using code or formulas to ensure internal records match external statements perfectly.
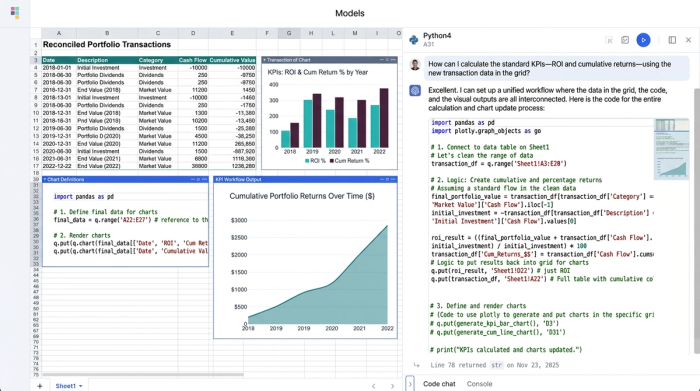
Step 3: calculating core portfolio KPIs
With clean data finally in place, it is immediately put to work. The user applies custom formulas and business logic directly adjacent to the reconciled datasets. This allows them to calculate essential metrics like return on investment, capital recovery, and cumulative returns across different portfolio segments. Because everything happens in one workspace, any updates to the raw data instantly flow through to the final KPI calculations.
Building a dynamic fund manager performance report
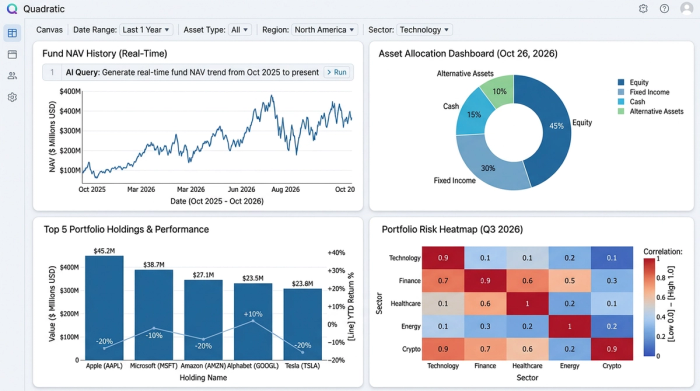
The ultimate goal of this workflow is a polished fund manager performance report. Because the data is already cleaned and calculated in Quadratic, the user generates a clear, refreshable financial summary directly on top of the reconciled data.
They add interactive elements to the canvas, creating filterable key performance indicators by product, status, and specific time periods. This level of dynamic reporting is especially critical for tracking multi manager funds performance, where aggregating data from various sources and different managers is notoriously difficult and prone to error. Stakeholders can now view an accurate, real-time snapshot of portfolio health without waiting for manual updates.
Conclusion: better workflows lead to better decisions
You do not need heavy, rigid enterprise software platforms to achieve robust data governance and reporting. By combining reconciliation, calculation, and reporting into a single Quadratic workflow, financial teams significantly reduce errors and speed up the decision-making process. Mastering managed funds performance starts with gaining total control over your underlying data. Try Quadratic today to build your own refreshable financial dashboards and streamline your portfolio monitoring workflows.
Use Quadratic to master managed funds performance
- Streamline your entire managed funds performance workflow by combining data ingestion, reconciliation, and reporting in one unified workspace.
- Consolidate multi-sheet portfolio data, including investment summaries and general ledger transactions, onto a single infinite canvas for a complete overview.
- Effortlessly reconcile messy financial data and fix inconsistencies using native Python, SQL, and traditional formulas directly within the grid.
- Calculate core portfolio KPIs like return on investment, capital recovery, and cumulative returns directly, with updates flowing instantly from raw data.
- Generate dynamic, refreshable fund manager performance reports and interactive dashboards for clear stakeholder insights, even across complex multi-manager funds.
Gain total control over your underlying data and streamline your portfolio monitoring workflows. Try Quadratic.