
Designing the perfect asset allocation is often the most exciting part of investing. You research, backtest, and determine the ideal mix of stocks, bonds, and alternatives. However, maintaining that allocation over time is a chore. Markets move, and your carefully crafted portfolio inevitably drifts. For most investors, fixing this requires a binary choice: hand over your assets to a rigid automated service that lacks nuance, or manually update a static spreadsheet every month.
Neither option is ideal for the sophisticated investor who wants control without the busy work. In this post, we will build a custom portfolio rebalancing tool in Quadratic that bridges this gap. By combining the live data connectivity of modern software with the flexible logic of a spreadsheet, you can build a dashboard that syncs live balances, calculates drift, and helps you rebalance using contributions for maximum tax efficiency.
The landscape of portfolio rebalancing tools
To understand why a custom build is necessary, it helps to look at the current market options. Generally, investors are forced to choose between two extremes.
On one side, you have automated software and robo-advisors. These are excellent for a "set it and forget it" mentality, but they often lack customization. They might force you into specific funds, fail to account for assets held outside their platform, or trigger taxable events by selling assets automatically.
On the other side, you have the manual spreadsheet. The traditional portfolio rebalancing tool in Excel offers infinite flexibility. You can track any asset you want and define your own logic. However, it is disconnected from the real world. Every time you want to check your drift, you have to log into three different brokerage accounts, download CSV files, and copy-paste data. This process is tedious and prone to human error.
There is a gap in the market for a solution that automates the data intake but leaves the decision-making logic to the investor. While you can download a free portfolio rebalancing tool template from various financial blogs, you ultimately pay for it with your time. A connected spreadsheet like Quadratic solves this by bringing live data directly into the grid.
Why precision matters: drift and tax efficiency
Before building the tool, it is important to define the logic we are trying to implement. The primary metric we are tracking is "drift"—the percentage by which an asset class deviates from its target allocation. If your target for US Equities is 60%, but a bull market pushes it to 65%, your drift is +5%.
Most basic tools solve this by telling you to sell the overweight asset and buy the underweight asset. However, selling winning assets in a taxable account triggers capital gains taxes, which drags down your long-term returns.
A superior strategy for those in the accumulation phase is the "new money" approach. Instead of selling, you use your monthly cash contributions to buy only the underweight assets. This brings your portfolio back into balance without generating a tax bill. Building this logic requires a tool that understands not just your current holdings, but also your available cash flow—logic that is difficult to find in rigid software but easy to script in Quadratic.
Building your custom tool in Quadratic
We are going to create a "Connected DIY" solution. This dashboard will sync your brokerage and cash accounts into a single view, allowing you to act like a professional portfolio manager. By using Quadratic, we can leverage Python and data connectors to create one of the best portfolio tracking and rebalancing tools available, tailored exactly to your strategy.
Step 1: Syncing live brokerage and cash data
The foundation of any dynamic dashboard is live data. In a traditional workflow, this is the manual bottleneck. In Quadratic, you can use built-in integrations or native Python to pull data directly from your sources.
You can set up connectors to pull live balances from your brokerage accounts and bank accounts. Because Quadratic supports Python, you aren't limited to standard stock tickers. You can pull data from APIs for alternative investments or connect to on-chain data if you need a robust crypto portfolio rebalancing tool.
The outcome is a raw data sheet that updates automatically or on demand. You no longer need to log into multiple portals to see your total net worth; the data flows directly into your spreadsheet grid.
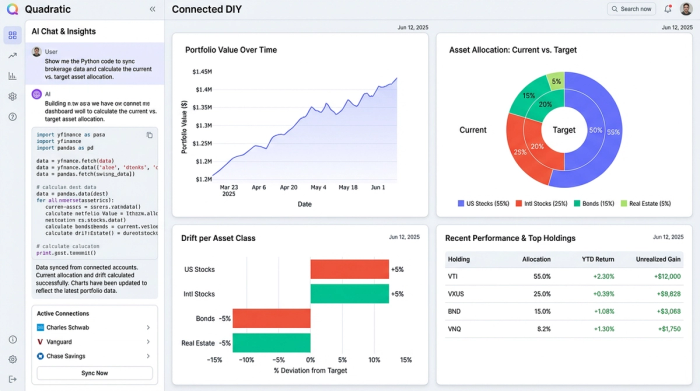
Step 2: Classifying holdings and setting targets
Once the raw data is in the grid, the next step is organization. Raw data usually gives you a ticker symbol (like "VTI" or "BTC") and a market value. You need to map these symbols to your strategic asset classes.
In a dedicated sheet, you create a mapping table. You might classify "VTI" as "US Equities," "BND" as "Fixed Income," and your high-yield savings account as "Cash."
Next, you define your "Target Allocation" reference table. This is where you set the rules:
- US Equities: 50%
- International Equities: 20%
- Fixed Income: 20%
- Alternatives/Crypto: 10%
This structure offers total control. Unlike automated platforms that might force you into a pre-set "Aggressive" or "Conservative" bucket, you define the categories and the weights.
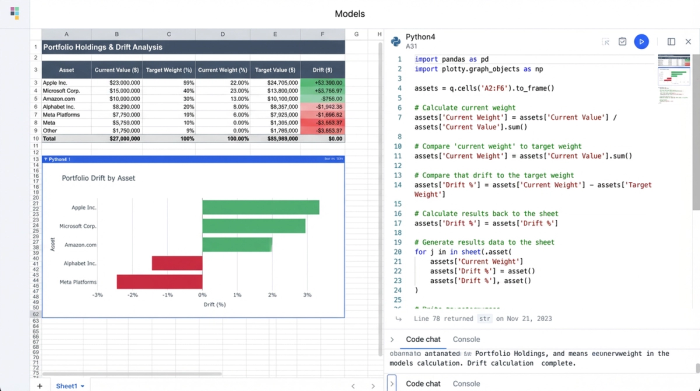
Step 3: Calculating drift and rebalancing logic
With your current holdings classified and your targets defined, you can now calculate the drift. This is where the power of the spreadsheet grid shines.
Using Python or standard formulas, you build the calculation logic:
1. Total Portfolio Value: Sum the current value of all connected accounts.
2. Ideal Value: Multiply the Total Portfolio Value by the Target Allocation percentage for each asset class.
3. Drift (Dollar Terms): Subtract the Current Value from the Ideal Value.
If the result is negative, you are underweight and need to buy. If it is positive, you are overweight. You can use conditional formatting to highlight these variances. For example, you might set a rule to turn a cell red only if the drift exceeds a 5% threshold, signaling that action is required.
Step 4: Executing the rebalance (the "new money" calculation)
This final step is where your custom tool outperforms generic software. Instead of simply telling you what to sell, we will program the tool to assist with tax-efficient buying.
Create an input cell for "New Contribution." This is where you enter the amount of cash you plan to invest this month (e.g., $2,000).
Using a simple Python script or formula within the grid, the tool distributes that $2,000 proportionally to the asset classes that are most underweight. It calculates exactly how many shares or dollars need to go into "International Equities" vs. "Fixed Income" to reduce the drift as much as possible using only the new cash.
This logic gives you the power of a hedge fund's execution desk, free of the constraints of rigid retail apps. You essentially have a portfolio rebalancing tool free of management fees that adapts to your specific cash flow situation.
Conclusion: The best of both worlds
This workflow resolves the dilemma between the "black box" robot and the manual spreadsheet. By building your own portfolio rebalancing tool in Quadratic, you gain the live data connectivity of a modern app combined with the infinite flexibility of a spreadsheet.
You ensure that your investment strategy adapts to your real life—handling contributions, withdrawals, and tax nuances with mathematical precision. You stop fighting with data entry and start focusing on high-level asset allocation decisions.
If you are ready to take control of your portfolio, you can start a blank Quadratic canvas today and build a tracker that works exactly the way you invest.
Use Quadratic to build a custom portfolio rebalancing tool
- Automatically sync live balances from brokerage and bank accounts, eliminating manual data entry.
- Define custom asset classes and target allocations, giving you full control over your investment strategy.
- Calculate portfolio drift with precision using Python or formulas directly in the grid.
- Implement tax-efficient "new money" rebalancing logic to allocate contributions to underweight assets.
- Consolidate all your investment data into a single, dynamic dashboard for a comprehensive view.
Ready to take control of your portfolio with precision? Try Quadratic.