Table of contents
- Why standard savings tools fall short
- The anatomy of a perfect savings system
- Building a connected Savings Goal Tracker in Quadratic
- The math of saving: automating gap analysis
- From tracking to action: recommended monthly transfers
- Best apps for tracking savings: why customization wins
- Conclusion: master your money with data
Managing personal finances often feels like a juggling act. You are trying to save for a down payment, plan a wedding, and build an emergency fund all at the same time, a common challenge when saving for multiple financial goals. The complexity arises not just from the amount of money you need to save, but from the timing; these goals compete for the same limited resources in your monthly budget.
Most people attempt to manage this using a static excel savings goal tracker or, even more manually, a printable savings goal tracker that they stick on the fridge. While these tools provide a snapshot of a moment in time, they become outdated the second you close the file or put down the pen. They cannot account for fluctuating income, unexpected expenses, or the daily changes in your bank account balance.
To truly optimize your financial path, you need a dynamic savings goal tracker—one that connects directly to your live financial data and monitors your progress in real time, leveraging the well-documented benefits of real-time financial data tracking. In this post, we will look at how to track savings goals using a connected workflow in Quadratic. We will move beyond simple logging and build a system that calculates your specific "savings gap" and automatically recommends the exact monthly transfers needed to keep your financial objectives on track.
Why standard savings tools fall short
If you search for solutions online, you will find countless apps to track savings goals. While many of these mobile-first applications are user-friendly, they often force users into rigid "buckets" or predefined categories that may not align with how you actually organize your money for effective category spend analysis, an issue often highlighted in discussions about the benefits and risks of personal financial apps. Some even require you to open multiple physical bank accounts just to separate your funds, adding unnecessary administrative overhead to your life.
On the other end of the spectrum is the traditional spreadsheet or free savings goal tracker template, which often comes with several disadvantages for budgeting and planning. These offer infinite flexibility but fall into the "static trap." They rely entirely on manual data entry. You have to log into your bank, check the balance, open the spreadsheet, and type in the numbers. Because this process is tedious, it rarely happens as often as it should.
There is a significant opportunity to bridge this gap. You need a tool that combines the flexibility of a spreadsheet—allowing you to define your own "Order of Operations" for your money—with the automation of an app. By building this in Quadratic, you can create an automated budget that acts as a financial operating system, adapting to your life rather than forcing you to adapt to a template.
The anatomy of a perfect savings system
Before we dive into the build, it is important to define what makes a robust financial system. To move from simple tracking to actual financial intelligence, your system needs to rely on math and live data, not just hope and manual logging.
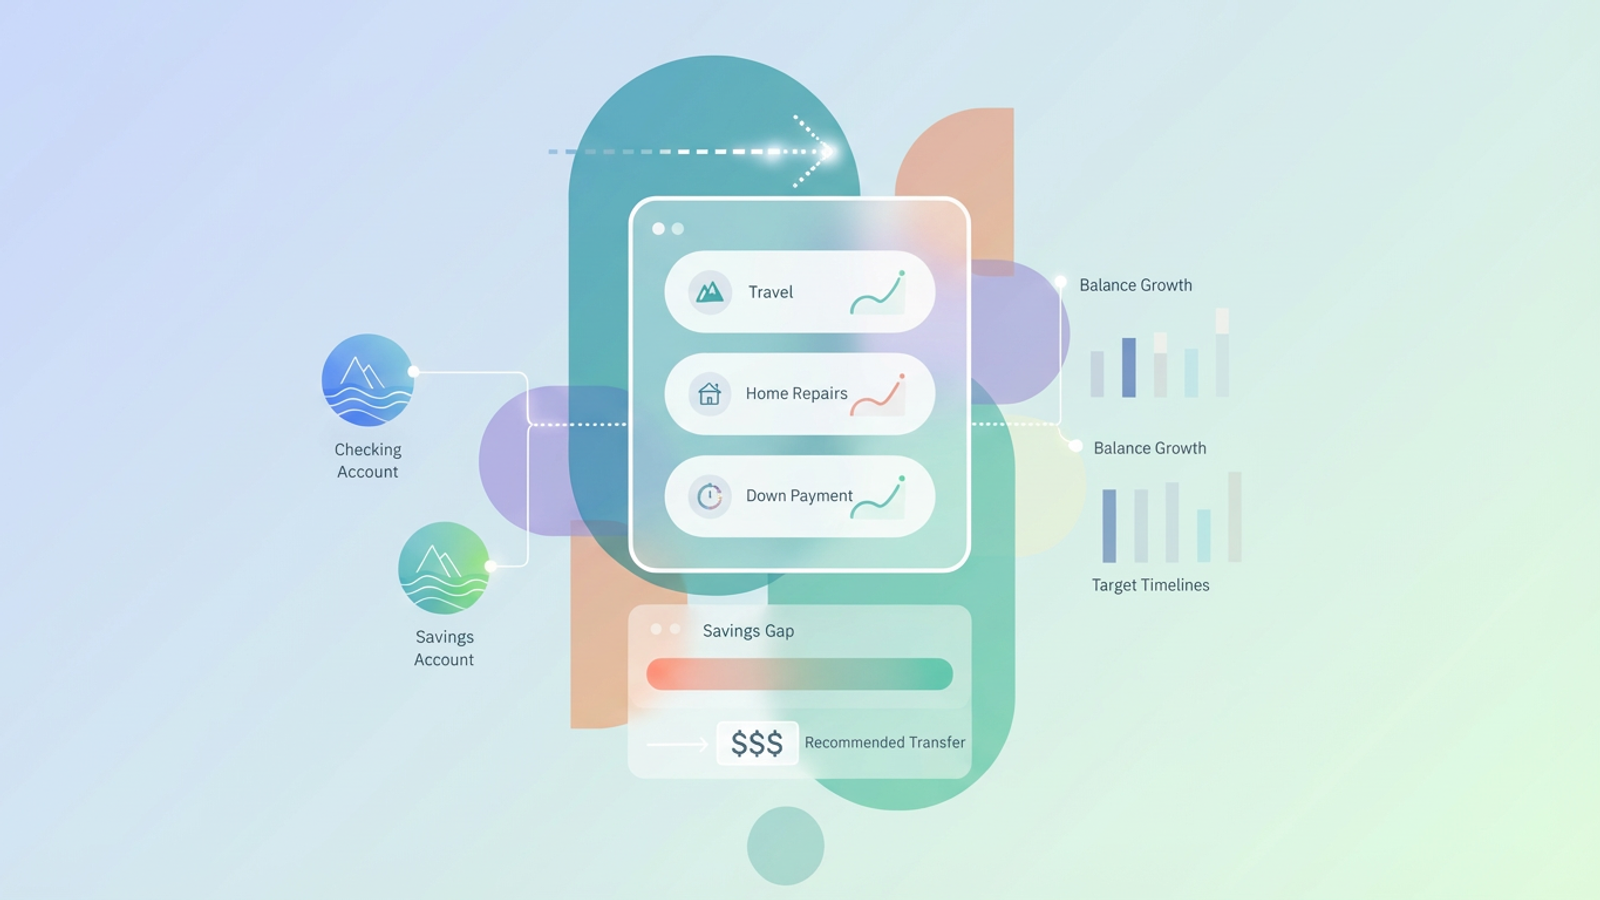
A high-functioning tracker must include four key components:
- Live balances: The system must pull real-time data from your checking and savings accounts.
- Target dates: Every goal must have a specific timeline (e.g., "Down Payment" by December 2025).
- The gap analysis: This is the mathematical core of the system. It calculates the difference between your current reality and your future goal.
- Actionable output: The system should not just show you a graph; it should give you specific instructions, such as "Transfer $500 to the High Yield Savings Account today."
Building a connected Savings Goal Tracker in Quadratic
Centralizing your data
The first step in this workflow is establishing a connection to your actual money. Instead of logging into three different bank portals, the user connects their checking and savings accounts directly to the Quadratic canvas. Using Quadratic’s ability to pull data from APIs or integrate with financial data providers, the raw balance data flows directly into the spreadsheet. This ensures that the "Current Balance" column is never an estimate; it is a fact.
Defining multiple goals
Once the data is flowing, the user sets up distinct rows for each objective, such as "Travel," "Home Repairs," and "Down Payment." This is where a custom build creates a distinct advantage over a standard money saving goal tracker. In a standard app, you might see these as isolated progress bars. In Quadratic, they exist in a unified table where you can weigh them against each other. You can allocate 20% of your available cash to travel and 80% to the house fund, and see immediately how that impacts your timeline.
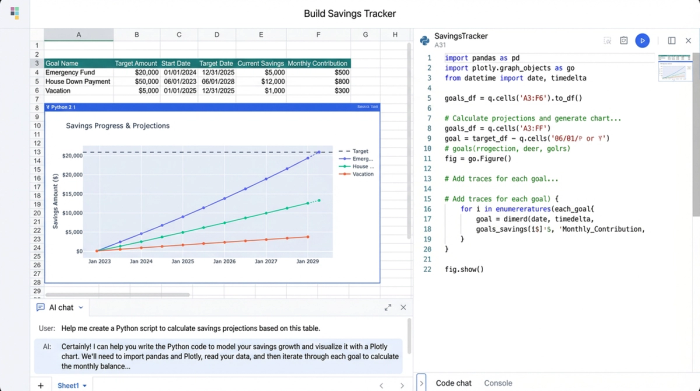
Visualizing progress
With the goals defined and the balances live, the user can visualize balance growth against target timelines. Because Quadratic supports Python, you can generate sophisticated financial data visualizations that go beyond standard bar charts, plotting your actual savings rate against the required trajectory to see if you are falling behind or getting ahead.
The math of saving: automating gap analysis
Many people search for financial calculators to help them understand compound interest or monthly requirements. The problem with online calculators is that they are isolated from your actual money. You type in your numbers, get a result, and then close the tab.
In Quadratic, the calculator is built into the workflow. The logic is simple but powerful:
1. Input: The user defines the Target Goal Amount and the Deadline.
2. Variable: The Current Savings Balance is pulled in automatically.
3. Calculation: The tracker calculates the "Gap"—the remaining amount needed to reach the goal.
Unlike a static calculator, this gap analysis updates every time your bank balance changes or you modify a target date. If you spend money from your savings account, the gap widens immediately, and the system alerts you to the change.
From tracking to action: recommended monthly transfers
The ultimate goal of any financial tool is to reduce anxiety and decision fatigue. You want to set it and forget it, trusting that the math is correct.
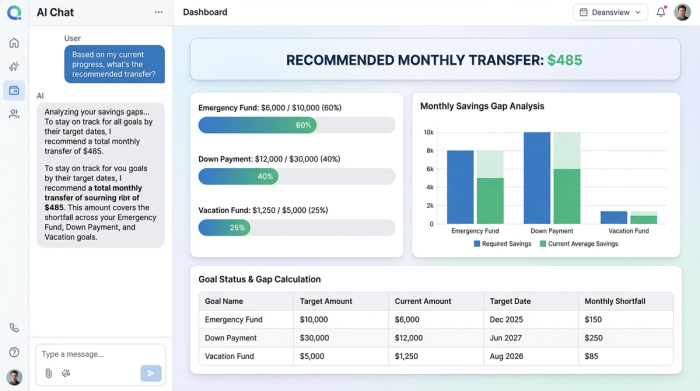
This workflow culminates in a specific feature: the Recommended Transfer, aligning with emerging principles for AI-driven financial planning that emphasize actionable insights. Based on the gap analysis and the time remaining until the deadline, the tracker outputs the exact dollar amount the user needs to move right now to stay on pace.
For example, if you are saving for a wedding in 10 months and have a gap of $10,000, the system will instruct you to save $1,000 this month. If you manage to save $1,500 this month, the system recalculates, and next month’s recommendation drops to roughly $944. This dynamic adjustment removes the guesswork. You do not have to wonder if you are saving enough because the math tells you exactly what to do.
Best apps for tracking savings: why customization wins
When looking for the best apps for tracking savings investing debt goals, you will find plenty of "all-in-one" solutions. These are excellent for general budgeting or for users who want a hands-off approach. However, for high-stakes goals—like buying a house or retiring early—generic apps often lack the precision required.
The best app to track savings goals is often the one you build yourself to fit your specific needs. If you are looking for a free savings goal tracker that you can print out and color in with a marker, a PDF is a fine choice for motivation. However, a printable tracker cannot calculate compound interest, adjust for a month where you overspent, or pull in live data from your bank.
If you want a financial operating system that adapts to the complexity of your life, building it in Quadratic offers superior control. You get the automation of an app with the granular control of a spreadsheet, allowing you to handle complex scenarios that standard apps simply ignore.
Conclusion: master your money with data
Moving from static tracking to dynamic monitoring is a pivotal shift in personal finance. When you rely on manual entry, you are always looking backward at what happened. When you use a connected, data-driven system, you are looking forward at what needs to happen next.
By building a gap analysis workflow in Quadratic, you turn your financial goals from vague hopes into mathematical certainties. You no longer have to guess if you can afford that vacation or the new house; the data is right there in front of you, updating in real time. Start building your own tracker today and take control of your financial future.
Use Quadratic to build a dynamic savings goal tracker
- Connect live financial data: Directly integrate bank accounts to pull real-time balances, eliminating manual data entry and ensuring accurate, always-current tracking of your savings progress.
- Define and prioritize multiple custom savings goals: Set distinct objectives like a down payment or emergency fund within a unified table, allowing you to weigh goals and allocate funds with immediate impact visibility.
- Automate "savings gap" analysis: Dynamically calculate the precise amount still needed for each goal, with updates in real-time as your bank balances change or target dates are adjusted.
- Generate actionable monthly transfer recommendations: Receive exact dollar amounts to move each month, ensuring you stay on pace to reach your financial objectives without guesswork.
- Visualize progress with custom charts: Create sophisticated visualizations to compare your actual savings rate against your required trajectory, quickly identifying if you are ahead or behind.
Ready to build your own dynamic savings tracker? Try Quadratic.