James Amoo, Community Partner
Jun 1, 2026

Table of contents
- What does messy data entail?
- The audit-first principle: find every problem before you fix any of them
- A column-by-column data audit checklist
- Map each problem class to a targeted fix
- How Quadratic streamlines the audit-first workflow
- Next step: audit your next messy spreadsheet in one place
- Frequently asked questions (FAQs)
Most attempts to clean messy spreadsheet data fail for a surprisingly simple reason: people start fixing before they've finished finding. They open a file, spot a few duplicates or stale data, then start trimming and reformatting. By the time they reach the bottom of the sheet, half the real problems are still hiding in plain sight, and several of the fixes have quietly masked deeper issues that will resurface in downstream analysis.
The standard advice you'll find online tends to reinforce this pattern, and most data cleaning tools default to the same fix-first sequence: duplicates, then blanks, then formatting, then move on. It feels productive, but it's tactical without being systematic. Issues you didn't know to look for never get caught, and changes accumulate without a clear record of what was wrong in the first place.
This post argues for a different sequence: audit first, fix second. You'll get a repeatable workflow to clean data in Excel spreadsheet by running a structured detection pass, generating a column-level inventory of every problem, and only then applying targeted fixes with AI, formulas, and Python.
What does messy data entail?
What messy data actually means becomes clearer once you recognize that most spreadsheets fail in the same recurring ways, regardless of industry or source system. Duplicate rows are one of the most common problems, including both exact duplicates and near-duplicates where casing or whitespace make records appear different even though they refer to the same entity. Missing values create another layer of ambiguity.
Formatting inconsistencies are another major class of issues. A spreadsheet may contain inconsistent date formats, mixed currency conventions, or decimal separators that vary by region. Text normalization problems are equally common, where “ Acme Corp,” “acme corp,” and “ACME CORP ” all refer to the same company but appear as separate values during grouping or analysis.
Mixed data types inside a single column also create downstream problems, especially when mostly numeric columns suddenly contain text notes or annotations. The goal is to recognize these issues as detection targets so the audit process can surface them deliberately rather than letting them silently distort downstream analysis.
Quadratic becomes useful because it combines spreadsheet workflows with Python, SQL, formulas, and AI-assisted analysis inside the same grid. Instead of manually hunting through tabs for inconsistencies, analysts can use Python and pandas directly in the spreadsheet to detect duplicates and validate column types while still keeping the visual spreadsheet context intact.
The audit-first principle: find every problem before you fix any of them
Interleaving detection and fixing is where most cleaning workflows go wrong. When you switch between modes, three things happen.
First, cognitive tunneling. Once you start fixing duplicates, your attention narrows to that problem class, and other issues fade into the background. Second, partial fixes mask deeper problems. Filling missing values before you've inventoried where they appear can hide patterns that would have told you the missingness was meaningful. Third, untraceable changes pile up. By the end of the session, no one (including you) can reconstruct what was wrong with the original file or whether anything was missed.
The cleaner approach is a hard separation between two phases. Phase one is audit: detect and document every problem, without changing anything. Phase two is to fix: apply the right tool to each problem class that the audit surfaced.
The deliverable from phase one is what makes this work: a column-level issue summary. For each column, you want a plain-language description of its data type, missingness, distinct values, formatting consistency, and any anomalies. That summary becomes your worklist for phase two, and it stays attached to the data as a record of what you found.
A column-by-column data audit checklist
Here's a checklist you can apply to any spreadsheet. Walk each column through every step before touching a single cell.
Column type and consistency
Confirm the expected data type for each column: numeric, date, string, boolean, or categorical. Then check whether the actual contents match. A column that should be numeric but contains stray text entries is one of the most common silent failures in downstream analysis.
Missing and blank values
Distinguish between true nulls, empty strings, whitespace-only cells, and sentinel values like "N/A," "-," "none," or "unknown." Each behaves differently in formulas and in Python. Count them per column and note where they cluster, because clustered missingness often signals a process or upstream data issue rather than random gaps.
Duplicates and near-duplicates
Look for three flavors: exact row duplicates (every cell matches), key-column duplicates (the same customer ID or invoice number appears twice with different details), and fuzzy duplicates (the same entity recorded with different casing, spacing, or punctuation). Each class needs a different fix later.
Formatting inconsistencies
Scan for leading and trailing whitespace, mixed casing, trailing characters, inconsistent date formats (MM/DD/YYYY vs. DD-MM-YYYY), inconsistent number formatting (1,000.00 vs. 1.000,00), and decimal or thousands separators that don't match across rows.
Category and label normalization
This is the area most data transformation guides under-treat, and it's where a lot of analysis goes wrong. Pull the distinct value list for every categorical column and look for variants that mean the same thing: "Electronics" / "Elec" / "electronics ", "USA" / "U.S.A." / "United States", "Q1 2024" / "Q1-24" / "2024 Q1". Also, flag values that look like typos or unexpected categories.
Resist the urge to fix as you go. Just record what you find.
Range and plausibility checks
Look for values that violate basic plausibility: negative ages, future-dated transactions, zero where zero is invalid, percentages above 100, prices below cost. This is practical sanity-checking, not statistical outlier detection. The goal is to catch the obviously broken, not to model the distribution.
Map each problem class to a targeted fix
Now that every problem is inventoried, switch from detection to correction. The audit gives you a worklist; this section gives you the right tool for each item.
The general rule is to use AI for ambiguous or judgment-based fixes, formulas for simple deterministic transforms, and Python for scale and complex logic.
Fixing duplicates
For exact duplicates and simple key-column duplicates, formulas like COUNTIF or UNIQUE handle the job. For fuzzy duplicates that differ only by casing, whitespace, or punctuation, normalize the key first (lowercase, trim, strip punctuation) and then dedupe. In Python, drop_duplicates() with a subset argument and a normalized helper column is the cleanest approach.
Filling or flagging missing values
The first decision is whether to drop, fill, or flag. That decision depends on whether missingness is meaningful in your data. If it's random, a default fill or computed value (median, mode, group average) may be appropriate. If it's meaningful, flag the rows for review or treat missingness as its own category. Both formulas (IF, IFERROR, COALESCE-style logic) and Python (fillna, where, conditional masks) can implement whichever you choose.
Standardizing text (whitespace, case, punctuation)
For small jobs, TRIM, CLEAN, UPPER, LOWER, and PROPER cover most of what you need. For larger or more complex normalizations, Python string methods and regex give you batch control: str.strip(), str.lower(), str.replace(), and pattern-based substitutions.
Fixing date and number formats
Coerce values to the target type and explicitly catch parse failures rather than letting them silently become nulls. In Python, pd.to_datetime(..., errors='coerce') followed by a check for newly-introduced nulls tells you exactly which rows failed to parse, which is often more informative than the original mess.
Normalizing categories
Build a mapping table from variant labels to canonical labels. For long-tail categorical columns, AI is particularly useful here. You can ask it to suggest a canonical mapping based on the distinct value list, then review and apply. Implementation is a lookup formula (VLOOKUP or XLOOKUP) or a Python merge or replace against the mapping table.
How Quadratic streamlines the audit-first workflow
Quadratic is built for exactly this kind of workflow. You import the messy file into a sheet, run an AI prompt against the data to generate the plain-language column-level issue summary, and place Python profiling code directly in the grid next to the raw data for a reproducible audit layer. Let’s explore the features of Quadratic in detail.
Import messy spreadsheets into a visible audit environment
Most spreadsheet cleanup projects fail before the cleaning even starts. Teams jump directly into deleting rows and rewriting formulas without first understanding what is actually wrong with the dataset. That creates a dangerous cycle where fixes introduce new inconsistencies and downstream reporting quietly breaks.
Quadratic is built around the opposite approach. It allows you to clean up Excel spreadsheet or CSV file imports directly into a browser-based spreadsheet, where the raw data and cleanup steps all remain visible in the same workspace. Instead of scattering work across notebooks and spreadsheet tabs, the entire diagnostic process stays attached to the source data itself.
Analysts can inspect the original file structure and preserve the untouched raw dataset while building a transparent remediation layer next to it.
Connect messy spreadsheets to live operational systems
Many spreadsheet problems originate from disconnected workflows. CSV exports drift from database schemas, manually edited files diverge from source systems, and recurring uploads introduce month-after-month inconsistencies.
Quadratic supports direct connections to databases, APIs, and external systems, allowing teams to compare messy spreadsheet data with live operational records during the audit process. SQL queries, formulas, and Python transformations can all operate against connected sources inside the same workspace.
A finance analyst can reconcile uploaded financial statements against a live warehouse database. A customer operations team can validate imported CRM exports against production records. A logistics group can compare manually edited shipment sheets against live API feeds.
Build reproducible audit checks with Python and SQL
Manual spreadsheet inspection works for small datasets, but larger operational files usually require systematic profiling and spreadsheet automation. That is where Python and SQL become critical.
Quadratic allows analysts to run native Python and SQL data analytics directly inside spreadsheet cells, which makes it possible to build reproducible audit layers directly next to the raw data. Teams can profile null distributions and validate business rules without leaving the spreadsheet environment.
A finance team auditing transaction exports can use pandas to identify duplicate invoice IDs and inconsistent currency formats. An operations team can validate ZIP codes, product SKUs, or customer IDs against expected patterns. A marketing analyst can profile campaign exports for attribution mismatches and malformed timestamps.
Use AI to clean spreadsheet data
The hardest part of cleaning messy spreadsheet data is often figuring out where the real problems are hiding. Duplicate rows, mixed data types, malformed dates, inconsistent formulas, missing values, and broken category mappings rarely surface cleanly through manual inspection alone.
Quadratic uses AI directly inside the spreadsheet to generate structured audit summaries from the imported data. Teams can prompt the AI to identify inconsistent column formats, highlight likely schema mismatches, flag suspicious outliers, detect empty or duplicated fields, and explain structural risks in plain language.
Instead of vaguely knowing that the spreadsheet feels unreliable, analysts get a concrete map of the issues, such as which columns contain mixed types and which values deserve manual review.
Let’s see how this works by importing a sample of dirty data into Quadratic.:
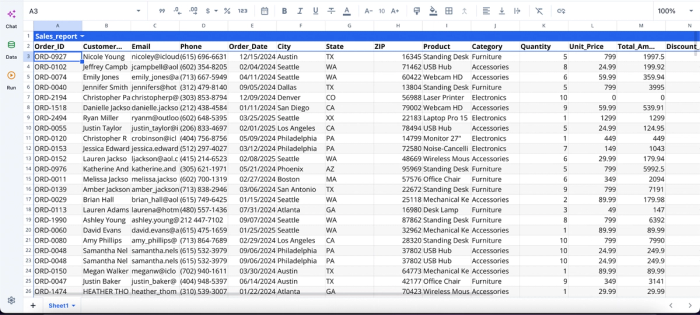
After successfully importing our data, we can immediately begin the cleaning and analysis process using Quadratic AI:
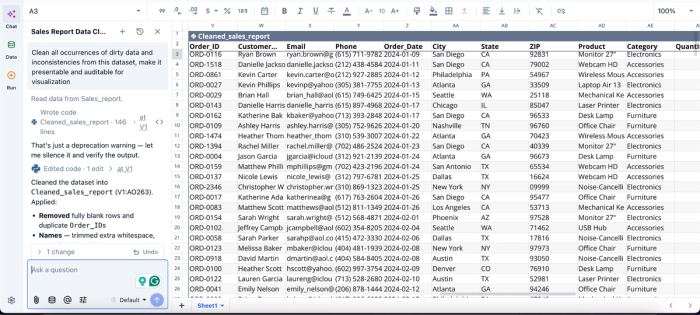
In this image, I ask Quadratic AI to “Clean all occurrences of dirty data and inconsistencies from this dataset, make it presentable and auditable for visualization.” It instantly creates a cleaned version of my dataset, fixing inconsistencies like duplicates, inconsistent formatting, and missing values.
Visualize data quality issues before they spread downstream
Messy spreadsheets often contain hidden patterns that are difficult to detect through raw rows alone. Visualization helps surface those risks early.
Quadratic supports native charting and AI-assisted visualization directly in the same grid where the audit happens. Analysts can generate missing-value heatmaps, duplicate-frequency charts, anomaly distributions, category balance comparisons, and trend breakdowns without exporting the data into another BI tool.
A finance team could create a financial data visualization on expense-category inconsistencies across departments. A supply chain team could chart missing shipment records over time. A sales operations group might identify unusual spikes in lead-source classifications caused by broken imports.
Visualization in Quadratic can also be done using text prompts:
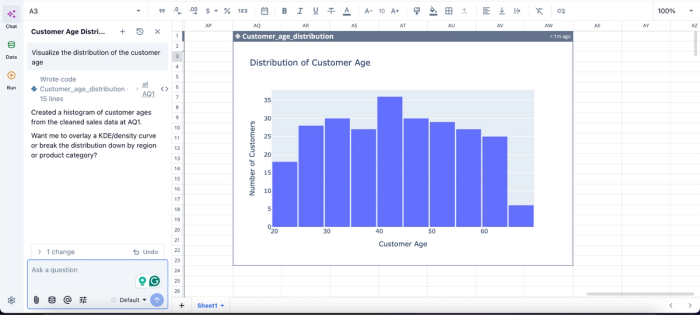
In this image, I ask Quadratic AI to “Visualize the distribution of the customer age.” In seconds, it creates a visualization of the distribution of customer age.
Collaborate on cleanup decisions in real time
Spreadsheet cleanup is rarely a solo process. One person understands the business logic, another owns the operational system, and someone else validates reporting outputs.
Quadratic’s browser-based collaboration model allows teams to audit, clean, validate, and document spreadsheet issues together in real time. The AI-generated summaries, Python profiling outputs, formulas, visualizations, and cleanup decisions all remain visible to every collaborator working in the sheet.
This reduces one of the biggest operational risks in spreadsheet remediation: undocumented tribal knowledge. Instead of relying on one analyst who remembers why a correction was made six months ago, the reasoning stays embedded in the workflow itself.
Next step: audit your next messy spreadsheet in one place
The shortcut to clean messy spreadsheet data is a complete audit before any fixes happen. When you know every problem before you start, the fixes become straightforward, and downstream analysis stops surprising you with errors that should have been caught upstream.
With Quadratic, you can import messy spreadsheet data into the grid and use AI to audit all problems first, then apply formulas, AI, or Python to fix them faster and more reliably. Audit first, fix fast, and keep it all in one place. Try Quadratic for free.
Frequently asked questions (FAQs)
What's the fastest way to clean messy spreadsheet data?
Audit first with AI, then apply targeted fixes by problem class. It feels slower at the start because you're not changing anything yet, but it's faster overall than fix-by-fix iteration because you stop discovering new problems halfway through.
How does Quadratic help with the audit-first workflow?
Quadratic unifies AI audits, Python profiling, and formula-based fixes in one grid, so your column-level issue summary and profiling code sit directly alongside your raw data. This keeps detection and correction in a single auditable document instead of scattered across tools.
How do I find all the problems in a spreadsheet at once?
Run an AI summary plus a Python profile against the raw imported data before editing anything. Together, they give you both the surprises (AI catches unexpected issues) and the reproducible counts (Python provides exact metrics) you need for a complete audit.