
James Amoo, Community Partner
Mar 9, 2026

Looking for the best BI tools often yields a familiar and overwhelming result: lengthy lists filled with feature comparisons, G2 badges, and polished marketing claims. While these lists can highlight popular platforms, they rarely address the factor that ultimately determines whether a tool succeeds within an organization.
In practice, the biggest challenge for data teams is not finding software with more features, but finding a platform tailored for your use case. Even the most powerful BI solution delivers little value if business users struggle to integrate it into their daily workflows.
Many organizations fall into the dashboard trap. They invest heavily in top-tier analytics platforms and spend months building beautiful dashboards. Yet, when business users need to make actual decisions, they export the data to a spreadsheet to perform the real analysis. The best tool isn't necessarily the one with the most chart types or the highest enterprise rating. It is the one that aligns with your team's actual workflow.
To find the best bi software for your organization, you must look beyond features and evaluate how the tool fits into the daily lives of your operations, finance, and growth teams.
1. Quadratic
Quadratic is a modern business intelligence platform that blends the flexibility of spreadsheets with the computational power of programming languages like Python and SQL. Traditional BI platforms often require users to move between separate tools for data analysis, modeling, and transformation. Quadratic simplifies this process by allowing analysts to perform all these tasks directly within a spreadsheet-style interface.
For business intelligence teams, this approach enables faster exploratory data analysis and data visualization. Analysts can pull live data from databases, manipulate it using code or formulas, and generate visualizations within the same environment. Because technical users and citizen developers can collaborate inside a familiar spreadsheet workflow, Quadratic helps teams transform raw data into actionable insights without the friction typically associated with BI tools.
Features of Quadratic
- AI-powered data analysis: Quadratic’s built-in AI helps analysts quickly explore datasets, generate queries, and identify trends or anomalies. This allows BI teams to move faster from raw data to actionable insights without manually writing complex analysis from scratch. Users can query their dataset using plain English and get results instantly. Let’s see how this works. First, I import my data into Quadratic:
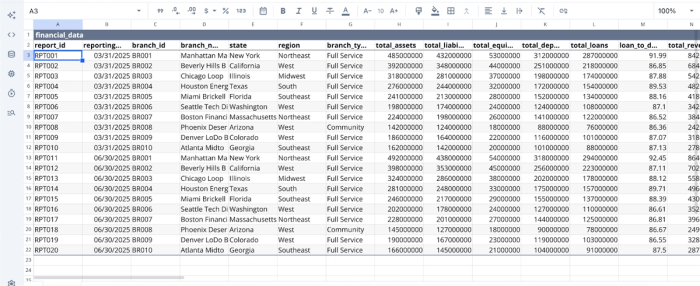
After successfully importing your data, you can immediately begin to generate insights from it. Here:
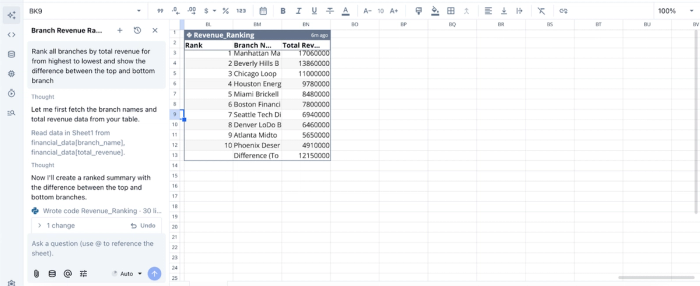
In this image, I prompt Quadratic AI, “Rank all branches by total revenue from highest to lowest and show the difference between the top and bottom branches”. It instantly generates a table showing the rank of the branches by revenue.
- AI data visualizations: Users can create charts and dashboards using AI prompts or code, enabling faster visualization of key metrics, trends, and performance indicators. This makes it easier for stakeholders to interpret data and understand business performance. Here’s an example:
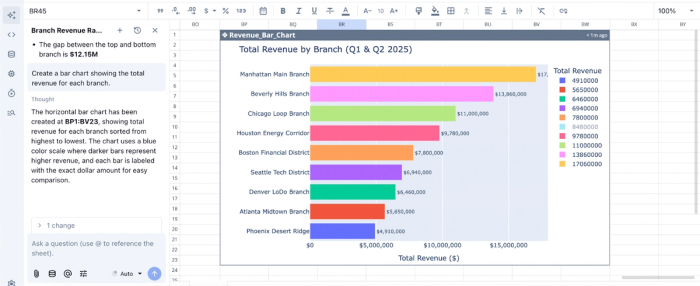
In this image, I ask Quadratic AI to “Create a bar chart showing the total revenue for each branch.” It instantly generates an interactive and customizable chart. If you do not explicitly state the type of chart you want, Quadratic still intelligently suggests the best chart type based on your dataset.
- Native support for programming languages: Quadratic supports Python, SQL, and JavaScript directly within spreadsheet cells. This allows analysts to perform advanced data cleaning, spreadsheet automation, and custom BI logic without switching to separate analytics tools.
- Direct connection to multiple data sources: Quadratic connects directly to multiple databases, APIs, and raw data. Analysts can query databases directly from the spreadsheet environment using SQL, enabling real-time access to operational and business data. This reduces the need for manual data exports and ensures dashboards are based on current information.
- Real-time collaboration: Being a collaborative analytics platform, Quadratic allows multiple team members to work on the same analysis, dashboards, or reports simultaneously. This makes it easier for analysts, product teams, and executives to align around shared business insights.
2. Tableau

Tableau is one of the most widely used business intelligence platforms for interactive data visualization and dashboarding. It is known for its intuitive drag-and-drop interface, which allows users to transform raw data into rich visual dashboards without writing complex queries.
In a BI environment, Tableau excels at turning large datasets into clear and interactive visual narratives. Users can connect to a wide range of data sources, build dashboards that track key metrics, and share insights across teams. It provides a powerful visualization engine that helps organizations identify trends, monitor performance, and make data-driven decisions faster.
Features of Tableau
- Drag-and-drop dashboard builder: Users can create interactive dashboards and visualizations without coding, making data exploration accessible to non-technical users and citizen developers.
- Broad data source connectivity: Users can connect to databases, spreadsheets, cloud data warehouses, and APIs to centralize analytics across multiple systems.
- Interactive data exploration: Users can filter, drill down, and interact with visualizations to uncover deeper insights behind business metrics.
- Advanced visualization capabilities: Users can build complex charts, geographic maps, and tell data stories that make patterns and trends easier to interpret.
3. Power BI
Power BI is a widely adopted business intelligence platform developed by Microsoft that enables organizations to analyze data and create interactive reports. It integrates deeply with the Microsoft ecosystem, including Excel and Azure, making it particularly attractive for companies already using Microsoft tools in their data infrastructure.
Power BI combines strong data modeling capabilities with powerful visualization features. Analysts can clean and transform data, build semantic models, and create dashboards that update in real time. These capabilities allow organizations to monitor performance, track KPIs, and deliver insights to decision-makers through interactive reports and dashboards.
Features of Power BI
- Power Query data transformation: Users can clean, reshape, and combine datasets from multiple sources to prepare reliable data for BI reporting.
- Interactive dashboard creation: Power BI allows users to build dynamic dashboards that visualize KPIs, operational metrics, and performance trends across departments.
- DAX data modeling language: Users can leverage Data Analysis Expressions (DAX) to create advanced metrics, calculated fields, and analytical models.
- Seamless Microsoft ecosystem integration: Power BI connects easily with tools like Excel, Azure, and Teams to embed business intelligence across everyday workflows.
4. Zoho Analytics
Zoho Analytics is a self-service business intelligence platform designed to help organizations analyze data without requiring extensive technical expertise. It provides tools for data preparation, visualization, and dashboard creation, allowing users to quickly transform raw datasets into actionable insights.
Zoho Analytics offers strong automation capabilities combined with AI-driven insights. Users can connect multiple data sources, build visual dashboards, and generate automated reports that highlight trends and performance indicators. These features help organizations make faster decisions by ensuring data insights are accessible across departments.
Features of Zoho Analytics
- Automated data integration: Zoho Analytics allows users to connect and sync data from databases, cloud applications, and spreadsheets to create a unified BI dataset.
- Self-service dashboard builder: Users can create interactive reports and dashboards without coding, enabling non-technical teams to explore data independently.
- AI-powered insights assistant: With Zoho Analytics, users can ask questions in natural language and receive visual analytics and insights automatically.
- Scheduled reporting and alerts: Users can automatically distribute BI reports and trigger alerts when important metrics change.
5. Sisense
Sisense is a business intelligence platform designed to embed analytics into applications and operational workflows. It is built to deliver insights directly inside the tools and products where users already work.
Its architecture is optimized for handling complex datasets and high-performance analytics. Sisense enables organizations to combine multiple data sources, build interactive dashboards, and embed analytics into customer-facing products or internal applications. This allows businesses to operationalize BI insights and make data-driven decisions directly within their daily processes.
Features of Sisense
- Embedded analytics capabilities: Sisense enables seamless dashboard integration and BI insights directly into internal applications or customer-facing platforms.
- High-performance data engine: It handles large and complex datasets efficiently, enabling faster query performance and analysis.
- Customizable interactive dashboards: Dashboards in Sisense can be tailored to specific departments, metrics, or operational workflows.
- Flexible data modeling tools: Users can combine data from multiple sources into unified analytics models for deeper business insights.
Matching the tool to your company stage
The right tool depends heavily on your organization's maturity and immediate needs.
For startups and e-commerce (speed & agility)
Startups and high-volume e-commerce businesses often prioritize speed above all else. They need to analyze transaction data, inventory levels, and the marketing funnel in real-time. For these companies, the best affordable bi tools for e-commerce are those that offer quick setup, handle high-transaction data without massive engineering overhead, and allow founders or ops managers to dig into the data directly.
For scale-ups and modern data teams (balance)
As companies grow, the need for governance increases. Data teams should establish platforms that allow the engineering team to set guardrails (governed data sources) while giving business operations the freedom to explore within those bounds. The goal is to avoid creating a bottleneck while ensuring that the core numbers (like revenue or active users) remain consistent.
Conclusion
The search for the best bi tools should not end with a tool that forces your team to specifically use Excel alternatives for data exploration. The most effective tools are those that support the full data analytics lifecycle: querying, analyzing, visualizing, and sharing, enabling effective data analysis for business intelligence. By prioritizing workflow compatibility over feature density, you can select a platform that empowers your team to move from passive monitoring to active decision-making.
Quadratic allows you to build a BI workflow that combines dashboards, ad hoc analysis, and shareable reporting in one place. Try Quadratic for free.
Frequently asked questions (FAQs)
What defines the best BI tool for an organization?
The best BI tool is one that truly aligns with your team's workflow, balancing governed reporting with the agility needed for ad hoc exploration. It goes beyond feature lists to prevent the dashboard trap where users revert to spreadsheets for actual analysis.
How does Quadratic serve as one of the best BI tools for modern data teams?
Quadratic acts as a connected analysis layer, offering a familiar spreadsheet interface that connects directly to live data via SQL and Python. This platform unifies governed reporting with flexible ad hoc analysis, enabling both technical and non-technical users to collaborate and explore data transparently in a single workspace.
What should one look for in the best AI BI platform?
When seeking the best AI BI platform, prioritize features that leverage AI to simplify complex analysis, such as natural language querying, trend explanations, and automated visualization generation. This empowers business users to interact with data more intuitively and accelerate their path to insights.