
Managing cash flow in a volatile market requires more than just looking at historical bank balances. For distribution and inventory-heavy organizations, maintaining financial health requires proactive cash forecasting. Finance leaders must anticipate market shifts, seasonal inventory demands, and currency fluctuations to ensure they have the cash on hand to operate smoothly.
The problem is that finance teams often have to rely on fragmented tools to build a complete picture. They might use one platform for foreign exchange hedging, another for seasonal inventory planning, and a third for calculating cash runway. Alternatively, they find themselves stuck with rigid enterprise resource planning modules that are too heavy and inflexible for custom forecasting.
The solution lies in building a unified, flexible workspace that combines internal financial data with live external factors. By bringing everything into a single environment, finance professionals can automate their multi-period forecasting, manage risk, and streamline stakeholder reporting. Recently, a finance professional in the distribution sector used Quadratic to build a comprehensive liquidity management system from the ground up. By blending formulas, Python, and APIs in one infinite canvas, they created a custom forecasting tool that perfectly fit their organization's unique needs.
The limitations of traditional liquidity management systems
When researching how to improve cash forecasting, finance leaders quickly run into the pain points of traditional liquidity management systems. The most glaring issue is the silo effect. Accounts payable, accounts receivable, inventory costs, and external market factors rarely live in the same place. Connecting these data points usually requires tedious manual exports and data manipulation.
Rigidity is another major hurdle. Without modern financial data analytics, traditional enterprise software can be difficult to customize for specific business nuances. A distribution company might have unique seasonal peaks or rely on international suppliers affected by specific regional holidays. Standard software modules often force businesses to adapt their workflows to the tool, rather than the other way around.
Finally, many teams fall back on static spreadsheets to bridge the gap. This leads to manual updates, where analysts spend hours copy-pasting foreign exchange rates or banking data just to keep the model current. These manual processes introduce the risk of human error and ensure that the forecast is outdated the moment it is finalized.
How to build a unified cash and liquidity management system in Quadratic
To overcome these limitations, a finance professional at a distribution company turned to Quadratic. They needed a cash and liquidity management system that was flexible enough to handle complex logic but familiar enough to use like a standard spreadsheet.
Quadratic provides an infinite canvas that natively blends spreadsheet formulas with Python, SQL, and APIs. This unique combination allows users to pull live data, transform it with code, and build financial models all in the same browser-based workspace. Here is how the user built their custom forecasting system.
Step 1: Integrating internal operations with external API data
The foundation of any accurate forecast is reliable data. The user started by pulling in real-time internal financial transactions, including accounts payable, accounts receivable, inventory costs, and historical sales. Quadratic makes it easy to connect directly to databases or export data from existing ERPs, giving the user a solid baseline of internal operations.
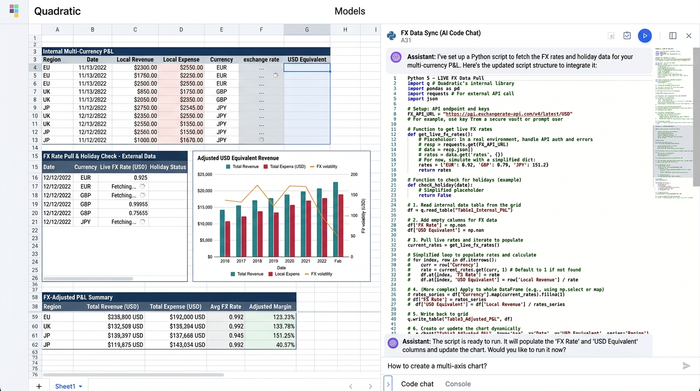
However, internal data is only half the picture. The true differentiator of this build was how the user incorporated external data. By writing a simple Python script directly in a cell, the user established a dynamic financial API integration to pull live external data into the spreadsheet. They fetched real-time foreign exchange rates and regional holiday schedules for their international suppliers, streamlining operational planning for public holidays that could otherwise delay inventory shipments.
This step is crucial for modern finance teams. When connecting internal operations with liquidity management system banking data, factoring in external variables automatically adjusts cash flow expectations. If a foreign bank is closed for a regional holiday, the system instantly flags that a supplier payment will be delayed, allowing the team to adjust their cash positioning accordingly.
Step 2: Multi-period cash flow forecasting and seasonality
With the data streams connected, the user moved on to the mechanics of the distribution use case. They built a system to generate multi-period cash flow forecasts, using a custom financial forecast template to project cash positions across weeks, months, and quarters.
Seasonality and inventory management are critical in distribution. The user leveraged Quadratic to calculate the minimum sales targets required to maintain liquidity during off-peak seasons. The model also helped prepare the balance sheet for holiday rushes, ensuring the company had enough buffer cash to purchase inventory ahead of peak demand.
Because Quadratic allows users to build custom formulas alongside Python scripts, the finance professional could easily factor in contingencies. They created dynamic cells that modeled different scenarios, helping the business understand exactly how much cash to hold in reserve. This level of customization elevates standard FP&A modeling into a highly effective liquidity cash management system that adapts to the natural rhythms of the business.
Step 3: Automating a liquidity risk management system for FX volatility
Foreign exchange volatility is a massive concern for any organization dealing with international suppliers. A sudden shift in currency values can unexpectedly drain a company's cash runway.
By integrating live FX data via Python, the user turned their Quadratic workspace into an active liquidity risk management system. The spreadsheet automatically translated foreign currency obligations into the reporting currency in real time.
This automation allowed the finance team to accurately monitor currency risk without manually checking rates. They could plan foreign exchange hedging strategies based on live market data and ensure that international payments were properly funded. Seeing the real-time impact of FX volatility directly next to their cash flow projections gave the team a significant strategic advantage.
Step 4: Tracking actuals and calculating cash runway
A forecast is only useful if it is measured against reality. The final step of the build involved creating dynamic financial health indicators directly in the Quadratic canvas.
The user built custom calculators and formulas to track actual sales performance against the forecasted minimum targets. As new sales data flowed into the spreadsheet, the system automatically updated the cash runway and liquidity ratios.
This setup provided a continuous feedback loop. If actual sales dipped below the seasonal forecast, the liquidity management system instantly recalculated the runway, giving the finance team early warning to delay non-essential expenses or draw on credit lines. Everything happened automatically in the background, keeping the analysis up to date without manual refreshes.
Empowering proactive decision-making and stakeholder reporting
Building a sophisticated model is a technical achievement, but the ultimate goal is driving better business outcomes. For CFOs and finance directors, this unified system provides critical, at-a-glance financial health indicators.
Instead of digging through multiple software platforms or deciphering static spreadsheets, leadership can look at a single Quadratic canvas. The visual nature of the workspace makes it easy to communicate complex cash flow models, FX impacts, and seasonal strategies to stakeholders, board members, or executive leadership.
When a board member asks how a sudden currency drop will impact the quarter's cash position, the finance team can simply adjust a variable in Quadratic and watch the entire model update instantly. This empowers proactive decision-making and elevates the finance team from reactive reporters to strategic advisors.
Conclusion: Future-proof your cash forecasting
Breaking down data silos and moving away from rigid enterprise software is essential for navigating today's financial landscape. A true liquidity management system must be flexible enough to handle internal operations, external market volatility, and multi-period modeling all in one place.
By combining the familiarity of a spreadsheet with the power of Python, SQL, and live API connections, Quadratic enables finance professionals to build custom tools that fit their exact requirements. You do not have to settle for fragmented workflows or manual data entry. Try Quadratic today to build your own custom forecasting and cash management models, and turn your financial data into a strategic advantage.
Use Quadratic to build a liquidity management system
- Integrate live data easily: Connect internal financial systems with external APIs using Python to pull real-time foreign exchange rates and supplier schedules directly into your sheet.
- Automate multi-period forecasting: Build flexible cash flow models that automatically adjust for seasonal inventory demand and minimum sales targets.
- Manage currency risk in real time: Track foreign currency obligations against live market rates to plan hedging strategies without manual data entry.
- Monitor cash runway dynamically: Create custom calculators that compare actual sales against forecasts, instantly updating your liquidity ratios as new data flows in.
- Simplify executive reporting: Share a single, collaborative canvas where stakeholders can adjust variables and see the immediate impact on cash positions.
Ready to eliminate manual spreadsheets and build a more agile financial model? Sign up today and Try Quadratic