James Amoo, Community Partner
Apr 17, 2026

Pulling reliable data from external sources into your predictive analytics workflows is notoriously difficult. A single broken connection or unexpected payload format can disrupt financial reporting. To build trustworthy models, effective financial API integration requires moving past one-off scripts and adopting structured data integration techniques. Creating reproducible data pipelines ensures that the information fueling your analysis is both accurate and resilient.
This article covers the core principles of building these pipelines, including schema design, error handling, data reproducibility, and modern tooling options that fit your team's workflow.
The challenge of modern financial data workflows
Data teams often find themselves caught in a frustrating middle ground. On one side, they rely on manual data wrangling and ad hoc data exploration that breaks the moment an endpoint changes. On the other side sits an overly complex enterprise infrastructure that requires significant engineering resources to maintain.
Inconsistent formatting and untrustworthy analysis become common occurrences when extraction processes lack structure. Understanding how financial API integration works at a fundamental level means recognizing the baseline process of moving data from the source to the insight. This data analytics strategy must seamlessly handle both real-time data ingestion and historical data processing without dropping records or requiring constant manual intervention.
A key complication in modern workflows is the variability of financial APIs themselves. Differences in rate limits, pagination schemes, and data schemas introduce additional layers of complexity that must be managed systematically. Without standardized handling of these nuances, pipelines become brittle and difficult to scale.
Another critical challenge lies in ensuring observability and reliability across the pipeline. Data teams need robust monitoring and alerting mechanisms to detect anomalies such as delayed updates or schema drift. Without these safeguards, issues can propagate downstream into dashboards and models. Building resilient financial data workflows t requires strong operational controls that guarantee data completeness and timeliness.
Essential best practices for financial API integration
Building reliable and repeatable data pipelines requires a disciplined methodology. These core principles apply regardless of the specific financial endpoint or banking service you need to access. By focusing on structure and resilience, you can protect your analytics workflows from upstream disruptions.
Define clear data requirements and standardize schemas
The first step in any robust pipeline is designing standardized data models before writing a single line of extraction code. Financial endpoints often return highly fragmented or raw JSON payloads. Without a defined schema, this raw data quickly becomes unmanageable.
You need a solid data infrastructure and analytics strategy to transition from these messy payloads to high-quality datasets. This is especially critical in B2B financial API integration, where you must standardize schemas across multiple diverse business data sources.
Implement robust error handling and rate limiting
Pulling heavy volumes of market or transactional data requires a realistic approach to scale. External servers impose strict limits to prevent system overload, and ignoring these constraints will result in blocked requests. Managing these limits effectively is a cornerstone of pipeline stability.
Practical implementation requires thoughtful orchestration of request flows, incorporating retry logic and failure handling mechanisms that prevent data loss. Systems should be designed to gracefully recover from transient issues such as timeouts or partial responses without compromising data completeness.
Ensure data reproducibility and auditability
Financial data pipelines must be fully reproducible to maintain strict data governance and compliance standards. When numbers dictate business data analysis, analysts must be able to trust the source. Structured workflows allow data teams to trace every metric back to its raw API source during an audit.
This level of traceability is vital when accuracy is non-negotiable. For example, API integration for financial close requires highly auditable and accurate data to ensure that final reporting is flawless. Reproducibility ensures that anyone reviewing the pipeline can run the same extraction process and arrive at the same numbers.
Design for scalability
As data volumes grow, pipelines must be designed to handle increasing load without degradation in performance. Financial APIs often deliver high-frequency or large-scale datasets, requiring efficient ingestion and automated data processing strategies that minimize latency and resource consumption.
This involves implementing batching and incremental data loading techniques to optimize throughput. Rather than reprocessing entire datasets, pipelines should focus on capturing only new or updated records.
Establish monitoring and data quality controls
Reliable financial pipelines depend on continuous monitoring and strong observability practices. Without visibility into pipeline health, issues such as delayed data or schema inconsistencies can go undetected until they impact business decisions.
Effective observability involves tracking key metrics such as data freshness and error rates, alongside implementing alerting systems that notify teams of anomalies in real time. This ensures that problems are identified and resolved before they propagate downstream.
How Quadratic unifies financial data ingestion and analysis
For technical teams who want to keep ingestion and analysis in one cohesive environment, Quadratic offers an ideal solution. Users can connect directly to live APIs using native Python and perform data analysis using SQL directly within a familiar spreadsheet interface. This approach removes the friction of moving data between disparate tools. Let’s explore this in detail:
Direct connections to multiple financial data sources
Quadratic enables direct ingestion from multiple financial data sources via its Plaid integration. Whether pulling market data or accounting entries, users can establish live connections that continuously update as new data becomes available.
This eliminates the traditional divide between extraction and analysis. Instead of building separate ETL or ELT pipelines, teams can query and transform data at the point of use, ensuring that datasets remain synchronized and reducing the risk of inconsistencies across environments.
AI-powered data analysis
Quadratic integrates AI directly into the transformation layer, enabling users to define, refine, and execute data processing logic with minimal overhead. From cleaning raw API payloads to normalizing schemas and detecting anomalies, AI agents for analysis can automate complex steps that would otherwise require extensive scripting.
This is particularly valuable for financial pipelines where data irregularities are common. AI-assisted analysis can identify outliers, reconcile mismatches, and enforce validation rules dynamically. Let’s see how we can analyze financial data via Quadratic’s financial API integration.
First, I connect to my bank account (via Quadratic’s Plaid integration):
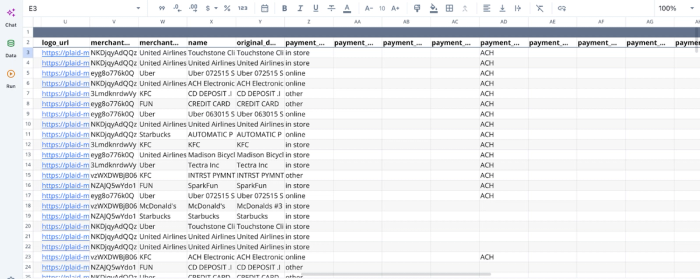
After successfully connecting to the financial data, we can immediately begin analysis:
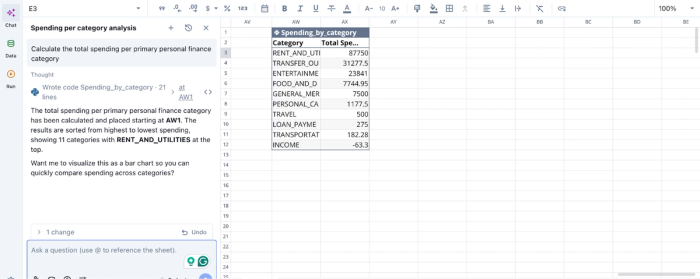
In the image above, I ask Quadratic AI to “Calculate the total spending per primary personal finance category”. It generates a table that shows the breakdown of my expenses across 10 categories. Users can ask any question about their data and get instant results in Quadratic.
AI data visualization
Beyond analysis, Quadratic provides AI-assisted financial data visualization that turns live data into interactive dashboards. These visuals can represent pipeline health or key financial metrics, giving teams immediate insight into both data quality and business performance.
Since these visualizations are directly tied to live data sources, they function as real-time monitoring layers. Teams can quickly detect anomalies, track trends, and validate outputs without exporting data into separate BI tools. Let’s see how we can create a visualization for the analysis we conducted earlier:
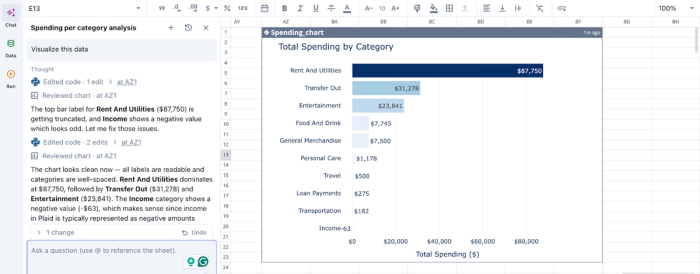
In the image above, I simply ask Quadratic to “Visualize this data”. In seconds, it creates a bar chart that shows the breakdown of total spending by category. Users do not need to specify the chart type, as Quadratic intelligently uses the most appropriate chart type based on your dataset.
Native support for programming languages
Quadratic supports Python, SQL, and spreadsheet formulas within a unified interface, allowing teams to build sophisticated data pipelines and analytical models in one environment. This enables everything from API data parsing to complex financial modeling without switching tools.
For financial API integration, this means data transformation logic, validation rules, and analytical computations can all be written and executed where the data resides. This reduces pipeline complexity and ensures that every step remains transparent and easily auditable.
Collaboration
Financial data workflows often involve multiple stakeholders, from data engineers to analysts and finance teams. Quadratic provides a collaborative analytics platform that allows users to build and refine pipelines together within a shared workspace.
With built-in versioning and change tracking, every modification to the pipeline is recorded. This creates a clear governance structure where teams can audit changes, validate assumptions, and maintain accountability.
Conclusion
Modern financial API integration requires a disciplined approach to be truly effective. Prioritizing structured schemas and strict reproducibility ensures that your extraction processes remain resilient.
Moving away from manual data wrangling and disconnected scripts leads to more reliable and actionable financial insights. Quadratic allows you to pull financial API data into a spreadsheet and turn it into reusable analysis and financial data visualization. Try Quadratic for free.
Frequently asked questions (FAQs)
What are the common challenges in financial API integration?
Data teams often face difficulties with inconsistent formatting and silent data failures when performing financial API integration. Relying on one-off scripts frequently leads to broken connections and untrustworthy analysis.
What options exist for integrating with financial and banking APIs?
Teams have several options for integrating with financial and banking APIs, including developing custom Python scripts for maximum flexibility or utilizing dedicated middleware and enterprise automation tools for robust infrastructure. Financial data API integration platforms offer a middle ground, providing structured extraction without requiring a dedicated engineering team.
How does Quadratic help improve financial API integration workflows?
Quadratic simplifies financial API integration by allowing users to connect directly to live APIs using native Python and SQL within a familiar spreadsheet interface. This approach unifies data ingestion and analysis, enabling financial services teams to build reproducible pipelines and avoid the overhead of deploying massive enterprise infrastructure.