James Amoo, Community Partner
Mar 9, 2026

Organizations today are often overwhelmed by the sheer volume of data they collect, yet still lack actionable insights. You may have terabytes of historical performance metrics, customer activity logs, and transaction records, but your team still finds it difficult to answer a simple question: “What’s likely to happen next?”
Choosing the best predictive analytics software often comes with navigating a crowded market of tools that promise to predict the future with high accuracy. However, "best" is a relative term. A tool with the most sophisticated algorithms is useless if your finance or operations teams cannot understand the output or apply it to their daily decisions.
The problem with many predictive tools is the isolation of the insight. Many tools generate accurate predictions that fail to drive value because they are locked away in static dashboards or complex code environments that stakeholders cannot manipulate.
The core idea of this guide is straightforward: the best predictive analytics software fits directly into existing operational workflows so insights can lead to real decisions. It closes the gap between a data scientist’s model and the practical actions business leaders need to take.
What defines modern predictive data analytics tools?
At a high level, predictive analytics software solutions are designed to ingest historical data, identify patterns, and forecast future outcomes. While traditional definitions focus heavily on statistical algorithms and formulas, modern definitions must include the advanced use cases like spreadsheet automation and AI spreadsheet analysis.
Legacy tools often function as black boxes. Data goes in, and a prediction comes out, but the logic remains hidden from the business user. This lack of transparency in predictive models creates a barrier to adoption. In contrast, modern software for predictive analytics focuses on transparency and interactivity.
The industry is shifting from passive viewing, where users stare at a read-only dashboard, to active planning, a shift enabled by effective data analysis for business intelligence. This means the software should not just tell you that revenue will drop next quarter; it should allow you to adjust inputs and write back decisions to your operational systems.
Why most predictive analytics software tools fail
Despite heavy investment in data science, many predictive projects stall at the last mile. This is the gap between data modeling and its adoption by the business.
Data scientists often build sophisticated models in Python or SQL, but business teams usually revert to offline sheets to do their actual planning. They do this because they need flexibility that rigid dashboards cannot provide. However, this creates a disconnect. The sophisticated model sits unused while decisions are made on traditional spreadsheets like Excel and Google Sheets.
Trust is a major barrier. If predictive analytics tools use proprietary algorithms, stakeholders often reject the results because they cannot see the logic. For instance, if a regional manager sees a sales visualization that looks wrong, and they cannot inspect the underlying assumptions, they will ignore the software and trust their gut.
Furthermore, many tools rely on static exports. If a prediction is exported to a CSV file and emailed to a stakeholder, it becomes stale data the moment it is shared. Teams require collaboration analytics platforms that do not isolate the analyst from the business user.
1. Quadratic
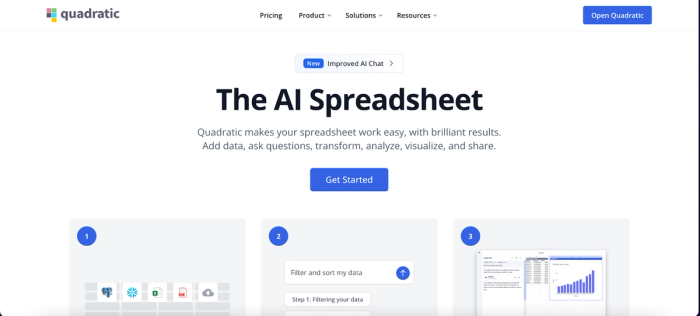
Quadratic is a modern analytics platform that combines the familiar interface of spreadsheets with the power of programming languages like Python, SQL, and JavaScript. Unlike traditional BI tools like Power BI and Tableau, Quadratic allows users to run code, manipulate data, and visualize results directly inside spreadsheet cells.
Quadratic stands out as a predictive analytics tool because it allows users to integrate Python libraries directly in the spreadsheet environment. Analysts can pull live data from databases, run statistical models, and immediately visualize forecasts in the same workspace. This bridges the gap between exploratory data analysis and decision-making.
Features of Quadratic
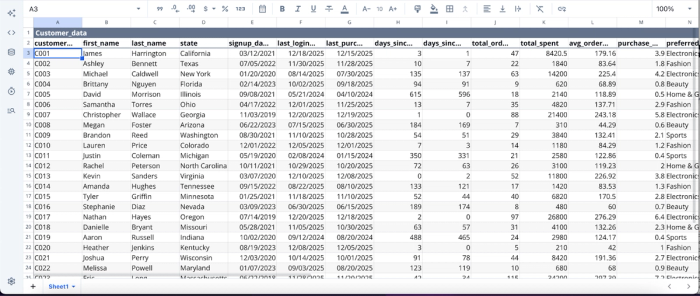
- AI-powered predictive analytics: Quadratic AI helps analysts quickly explore datasets, identify patterns, and generate code. This accelerates the early stages of predictive modeling by helping teams uncover correlations and trends through simple questions. Let’s see an example. First, I import my data into Quadratic:
Suppose I want to get a list of customers who are likely to churn. I simply use text prompts:
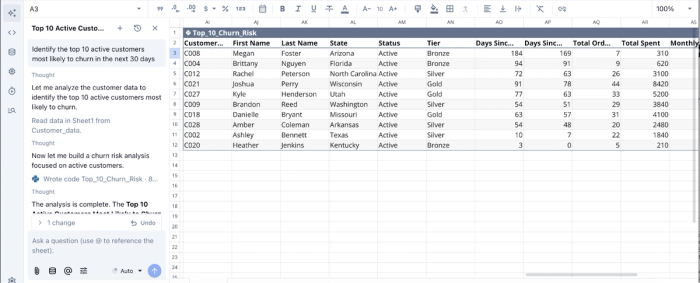
In the image above, I ask Quadratic to “Identify the top 10 active customers most likely to churn in the next 30 days”, and it instantly generates a table to show the churn risk, alongside relevant details.
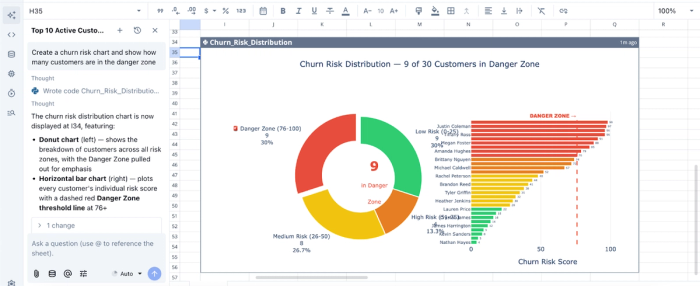
- AI data visualizations: Users can generate charts and visualizations with AI prompts or code to quickly display forecasts, model outputs, and trend projections. This makes it easier to communicate predictive insights and validate model results visually. Here’s an example:
In this example, I ask Quadratic AI to “create a churn risk chart and show how many customers are in the danger zone.” Within seconds, it generates a visualization that clearly highlights customers with a high likelihood of churn. This makes it easy for teams to quickly identify at-risk customers and understand the overall churn risk distribution at a glance.
- Native support for programming languages: Quadratic supports Python, SQL, and JavaScript directly within spreadsheet cells. Analysts can run Python libraries to build forecasting models and predictive pipelines without switching tools.
- Integrations: Quadratic can connect directly to multiple databases, raw data, and APIs, allowing predictive models to run on up-to-date data. This enables teams to monitor trends and update forecasts as new information becomes available.
- Collaboration: Quadratic provides a collaborative environment that enables teams to work together on predictive models, share analyses, and review forecasting logic in real time. This helps ensure predictive models are transparent, auditable, and aligned with business decision-making.
2. ThoughtSpot
ThoughtSpot is an AI-native analytics platform built around search-driven data exploration. Instead of building complex dashboards or queries, users simply ask questions in natural language, and the platform generates insights, charts, and predictions automatically. This makes AI data modeling accessible to non-technical users and citizen developers who may not have expertise in SQL for data analysis.
The platform also incorporates automated machine learning and anomaly detection capabilities that help organizations identify patterns and forecast future outcomes. By embedding predictive insights into everyday workflows, ThoughtSpot helps businesses move from descriptive reporting to decision-making.
Features of ThoughtSpot
- Natural language data search: Users can ask questions about their data in plain language and instantly generate insights, visualizations, and predictive trends.
- SpotIQ automated insights engine: Its insights engine automatically scans datasets to detect correlations, anomalies, and emerging patterns that may signal future outcomes.
- Time-series forecasting models: ThoughtSpot’s forecasting models allow users to predict future performance of KPIs such as revenue, traffic, or demand based on historical data trends.
- Interactive Liveboards dashboards: It features dynamic dashboards that allow users to explore predictive results and drill into the factors driving forecasts.
3. Qlik Sense
Qlik Sense is a business intelligence and analytics platform known for its associative data engine, which allows users to explore relationships between datasets freely. Unlike traditional BI tools that rely on predefined queries, Qlik Sense lets analysts interactively uncover patterns, correlations, and drivers of change across large datasets.
Its predictive analytics capabilities are powered by Qlik AutoML, which automatically trains machine learning models on historical data. These models can generate predictions, identify key influencing variables, and embed predictive insights into dashboards.
Features of Qlik Sense
- Qlik AutoML model generation: This feature automatically trains machine learning models and produces predictions without requiring deep data science expertise.
- Associative data engine: Qlik Sense’s associative data engine helps to reveal hidden relationships between datasets, helping analysts identify variables that influence predictive outcomes.
- Interactive predictive dashboards: Users can visualize forecasts, probability scores, and predictive insights directly within BI dashboards.
- Real-time and streaming analytics: Users can analyze incoming data streams to update predictions and detect trends as they emerge.
4. Alteryx
Alteryx is a data analytics and automation platform designed to help analysts prepare, blend, and model data with minimal coding. Its visual workflow interface allows users to design complex analytics pipelines using drag-and-drop components, making advanced analytics accessible to a wide range of business users.
Alteryx includes a library of statistical and machine learning tools that support regression analysis and time-series forecasting. It also integrates with Python and R, allowing advanced users to extend predictive models while still benefiting from its automated data preparation and workflow management capabilities.
Features of Alteryx
- Visual predictive workflow builder: Users can create machine learning pipelines using drag-and-drop components instead of manual coding.
- Pre-built predictive modeling tools: Its modeling tools include regression, clustering, classification, and forecasting algorithms for common predictive tasks.
- Automated machine learning (AutoML): Alteryx’s AutoML automatically trains, tests, and compares predictive models to identify the most accurate approach.
- Python and R integration: Users can extend predictive capabilities with custom machine learning scripts and advanced statistical libraries.
See what the best Alteryx alternative is.
5. Adobe Analytics
Adobe Analytics is an enterprise analytics platform focused on understanding digital customer behavior across websites, apps, and marketing channels. It enables organizations to analyze engagement patterns, measure campaign performance, and track customer journeys across multiple touchpoints.
Its predictive analytics capabilities are powered by Adobe Sensei, the company’s AI and machine learning framework. Sensei automatically identifies patterns in customer behavior, forecasts engagement trends, and predicts outcomes such as conversion likelihood or churn risk. These insights allow marketing and product teams to optimize campaigns before performance declines.
Features of Adobe Analytics
- Adobe Sensei AI predictions: It uses machine learning to forecast customer behavior, engagement trends, and marketing outcomes.
- Predictive audience segmentation: Users can identify customer segments that are most likely to convert, churn, or engage with specific campaigns.
- Automated anomaly detection: Its anomaly detection feature helps to detect unusual spikes or drops in digital metrics that may signal emerging opportunities or risks.
- Customer journey analytics: Users can map interactions across channels to predict future engagement and conversion behavior.
Conclusion: Choosing the right tool for your team
When selecting the best predictive analytics software, you should avoid the trap of buying the tool with the most complex algorithms if your team cannot use it. The true value of predictive analytics lies in adoption and action.
If your predictive models are currently trapped in code repositories or static dashboards, you are missing the opportunity to influence daily business decisions. The goal is not just to predict the future, but to shape it through informed action.
Stop relying on static exports and disconnected workflows. With Quadratic, you can build a predictive model using your own live business data. Try Quadratic for free.
Frequently asked questions (FAQs)
What is the main challenge with finding the best predictive analytics software today?
The primary challenge isn't just prediction accuracy, but ensuring insights are actionable and integrated into daily operations. Many predictive analytics tools generate precise forecasts that remain isolated, failing to drive real business decisions or planning.
How does Quadratic address the challenges of traditional predictive analytics platforms?
Quadratic is an AI spreadsheet that combines native Python and SQL within a familiar grid interface, allowing data scientists to build rigorous models. Business users can then interact with, audit, and run scenarios on live data, providing transparency and bridging the gap between forecast and action.
What key features should I consider when evaluating predictive analytics software solutions?
When evaluating predictive analytics software solutions, prioritize transparency, seamless integration with existing workflows, and real-time collaboration capabilities. The top predictive analytics tools also offer live data connectivity.