
Table of contents
- The core pillars of stock analysis: theory vs. practice
- A modern workflow: step-by-step financial statement analysis for stocks
- Conducting dynamic peer group comparisons
- Integrating technical analysis and stock charts
- Constructing the final investment thesis
- Upgrading the tools used by financial advisors for stock analysis
- Conclusion
Modern investment research is exceptionally complex. Today's markets move rapidly, requiring analysts and investors to process massive amounts of information to find a true edge. A comprehensive approach to financial analysis for stocks involves blending qualitative insights about a company's management and competitive moats with hard quantitative data. However, knowing what to analyze is only half the battle.
The real challenge lies in the execution gap. While understanding the theory behind valuation is straightforward, building an efficient, repeatable workflow to process live market data is much more difficult. This guide explores how to move beyond basic theory and build robust, data-driven investment reports.
The core pillars of stock analysis: theory vs. practice
Any rigorous investment research begins with a firm grasp of foundational concepts. Analysts typically rely on two primary schools of thought. Fundamental analysis evaluates the intrinsic value of a company by examining its business model, financial statements, and market position. Technical analysis looks at historical price patterns and trading volumes to forecast future market behavior. The most successful analysts blend both approaches to get a complete picture of a potential investment.
A key part of this process involves calculating valuation metrics. Ratios like price-to-earnings, price-to-book, EV/EBITDA, and return on equity are essential for determining if a stock is overvalued or undervalued. But calculating these metrics manually on a notepad or a static stock tracking spreadsheet is entirely outdated. Modern analysts do not just calculate numbers once. They build dynamic, automated models that update instantly as new data becomes available.
A modern workflow: step-by-step financial statement analysis for stocks
To understand what this looks like in practice, consider a financial analyst tasked with building a comprehensive report on a target public company. Performing financial statement analysis for stocks requires deep access to income statements, balance sheets, and cash flow data. Historically, this meant toggling between financial terminals, web browsers, and traditional spreadsheets while manually copying and pasting numbers.
Using Quadratic changes this workflow entirely. Instead of wrestling with fragmented tools, the analyst pulls live financial market data and company fundamentals directly into their workspace. Quadratic connects to live data sources or any python stock market api, allowing the user to import real-time market data directly into the grid. This eliminates the risk of copy-paste errors and ensures the underlying data is always current. From there, the analyst can seamlessly explore, clean, and transform the raw data into a structured financial model or a custom python stock tracker.
Conducting dynamic peer group comparisons
Evaluating a target company in a vacuum rarely provides enough context. A critical step in the research process is benchmarking the target against its industry peers through relative valuation.
This is where a modern spreadsheet environment offers a significant advantage. Within Quadratic, the analyst can leverage native Python or SQL directly alongside standard spreadsheet cells. This allows them to quickly filter out irrelevant companies, clean messy datasets, and rank comparable businesses based on specific valuation multiples. By writing a few lines of code or using built-in AI tools to generate the Python scripts, the analyst creates comparative financial tables that update dynamically based on live data feeds. If a competitor releases a new earnings report, the peer comparison model instantly reflects the new reality.
Integrating technical analysis and stock charts
While fundamental data tells you what to buy, technical analysis often helps dictate when to buy. Conducting financial time series analysis on historical stock prices, moving averages, and trading volume fits naturally into the broader investment research picture.
Visualizing this data effectively is crucial for making informed decisions. Traditional workflows often force analysts to use a separate charting application, breaking their concentration and separating the visual data from the fundamental numbers. Quadratic solves this by utilizing an infinite canvas. The analyst can place interactive stock charts right next to their fundamental financial tables. This unified view means they can spot a technical breakout on a chart and immediately verify if the company's recent cash flow growth supports the price action without ever leaving the spreadsheet.
Constructing the final investment thesis
A thorough analysis is only as valuable as the conclusions it produces. Every research project must end with a clear, actionable pitch. A structured investment thesis typically includes qualitative factors like management strength and competitive moats, an overview of the macro and micro environment, potential risks, projected upsides, and a final verdict.
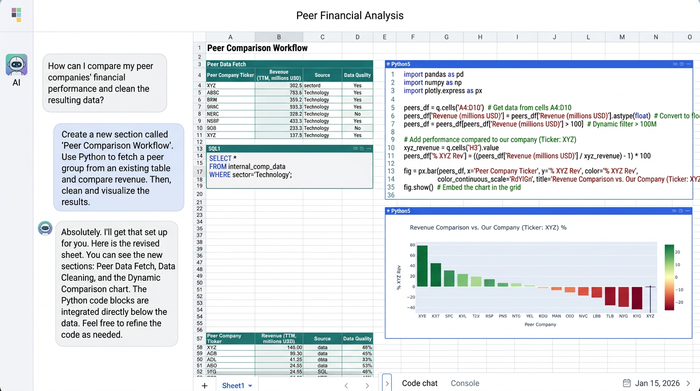
Bringing all these elements together into a cohesive presentation can be challenging. By using the infinite canvas in Quadratic, the analyst can arrange the company profile, the dynamic comparative tables, the technical charts, and the written text in a logical flow. This spatial organization creates a highly readable, interactive presentation for stakeholders, leveraging visual analytics to support complex decision-making. Decision-makers can review the final verdict while simultaneously scrolling over to see the live data and code that support the analyst's conclusions.
Upgrading the tools used by financial advisors for stock analysis
For years, the standard tech stack in finance has been highly fragmented. Analysts relied on a combination of a static investment portfolio spreadsheet, expensive financial terminals, separate charting software, and slide decks to get their point across. This disjointed approach slows down research and creates friction when updating models.
Today, the tools used by financial advisors for stock analysis are evolving toward unified, intelligent workspaces. Artificial intelligence plays a massive role in this shift. Whether it is using an AI assistant to help write Python code for complex data pulls or generating formulas for intricate valuation ratios, AI drastically accelerates the research process and reshapes professional practices. When looking for the best AI for financial analysis stock scenarios, professionals need more than just a chatbot bolted onto a legacy tool. They need a native environment where AI can securely read sheets, write formulas, and manipulate data directly. Quadratic serves as this ideal environment, seamlessly combining the familiarity of a spreadsheet with Python, SQL, AI capabilities, and an infinite canvas.
Conclusion
Mastering investment research requires a deep understanding of core financial metrics and the right environment to execute that research efficiently. Moving from static, theoretical spreadsheets to a dynamic workspace allows analysts to uncover deeper insights and make faster, more accurate decisions.
By bringing live data, code, and visualizations into one infinite canvas, workflows become repeatable and highly collaborative. Instead of wasting hours updating outdated models, you can focus on finding the next great investment opportunity. Try Quadratic for your next investment research project and experience a faster, more intelligent way to analyze the markets.
Use Quadratic to do financial analysis for stocks
- Connect directly to live stock market data, financial statements, and APIs to eliminate manual copy-pasting and keep your models automatically updated.
- Write Python and SQL directly in the spreadsheet grid to clean complex datasets, calculate valuation metrics, and build dynamic peer group comparisons.
- Organize your entire research workflow on an infinite canvas, placing interactive price charts right next to fundamental valuation tables.
- Use built-in AI tools to write scripts, generate formulas, and automate tedious data transformation tasks.
- Collaborate in real time with colleagues to build, review, and present interactive investment theses in a single workspace.
Ready to build faster, more intelligent models for your investment research? Try Quadratic
