James Amoo, Community Partner
May 19, 2026

Table of contents
- Why most Python tracking scripts fail over time
- Step 1: Define your ticker universe and data sources
- Step 2: Extract and clean market data (the ETL approach)
- Step 3: Calculate metrics and technical indicators
- Step 4: Build a consistent, auditable dashboard
- Unifying the workflow: Building your tracker in Quadratic
- Conclusion
- Frequently asked questions (FAQs)
Anyone who manages financial data in traditional spreadsheets knows the daily grind of manual data exploration. Copying and pasting stock quotes in Excel and hunting down missing data points can quickly become a frustrating and error-prone routine. Transitioning to an automated data processing workflow offers a clear solution. By leveraging code, you can save hours of manual work and eliminate the human errors that inevitably creep into manual data entry.
However, writing a quick script to pull price history is only half the battle. To truly upgrade your workflow, you should not just write a one-off script. The goal is to build a repeatable data product for long-term stock portfolio tracking. A well-designed Python stock tracker ensures consistent data and auditable outputs that you can trust day after day.
Why most Python tracking scripts fail over time
Moving from traditional spreadsheets like Excel and Google Sheets to a code-based solution often starts with good intentions but ends in a tangled web of fragmented files. A common pitfall is writing isolated scripts to download historical stock data to a local folder, requiring you to run them and piece the data together later manually. These scripts are notoriously hard to maintain as your portfolio grows or when data sources change their formatting.
To solve this, many users overcompensate by introducing complex backend infrastructure. They might spin up external databases or implement heavy orchestrators like Airflow just to manage a personal or team investment portfolio spreadsheet. This approach overcomplicates the architecture and creates a high barrier to entry for team members who just need to view the data.
Furthermore, these backend-heavy setups often ignore the final presentation layer. Without a clear investment dashboard for portfolio tracking, the extracted data remains difficult to audit and practically useless for actual decision-making. A reliable Python stock portfolio tracker needs a unified home where the data can be easily seen and analyzed.
Quadratic helps eliminate this fragmentation by combining live data access, Python execution, spreadsheet flexibility, and visualization in a single collaborative environment. Instead of maintaining disconnected scripts and separate softwares for stock market analysis, users can ingest portfolio data, run Python-based calculations, and build interactive tracking dashboards directly inside one workspace.
Step 1: Define your ticker universe and data sources
The foundation of a reliable stock tracking spreadsheet is a clear list of target assets. Before writing any code, define the exact scope of your tracker. Decide whether you are monitoring a specific sector or a broad market index. Keeping this ticker universe well-defined prevents your tracker from pulling unnecessary data and slowing down your workflow.
Next, identify reliable data sources. Financial libraries and APIs like yfinance or Alpha Vantage are excellent choices for programmatic data extraction. When planning your research and data analysis, look beyond simple price history. A comprehensive tracker should incorporate richer datasets, including company fundamentals and quarterly financial statements, to provide a complete picture of asset health.
Keep in mind that the purpose of this build is strictly tracking and monitoring. This scope explicitly avoids automated trading strategies or specific investment advice, focusing entirely on creating a reliable environment for portfolio analysis.
Step 2: Extract and clean market data (the ETL approach)
Treating your tracker as a data product means applying data engineering best practices. Frame your data retrieval process around the Extract and Transform phases of an ETL pipeline. Start by setting up your Python code to fetch market data on a consistent schedule.
Once the raw data is extracted, it must be cleaned before it can be trusted. Essential data preprocessing steps include:
- Handling missing values or stale data in trading days
- Normalizing date formats across different APIs or geographic markets
- Removing outliers or correcting split-adjusted pricing anomalies
Rigorous data quality checks are required during this data transformation phase. If your Python stock tracker ingests flawed data, every downstream calculation will be compromised. Implementing automated checks ensures a solid data infrastructure and analytics strategy.
Step 3: Calculate metrics and technical indicators
With clean data secured, you can begin processing it to calculate accurate portfolio performance and custom metrics. This is where Python truly outshines manual spreadsheet formulas. You can write functions to calculate daily returns and portfolio weightings with precision, similar to an asset allocation calculator.
You can also integrate richer datasets and complex calculations into your workflow. Depending on your monitoring needs, you might calculate moving averages, create a stock screener with Python, or build custom technical indicators that give deeper context to market movements.
The most important aspect of this step is making your calculations repeatable. By writing modular Python functions, your logic will automatically apply to new data as it flows in. This ensures your metrics remain accurate and up-to-date without requiring manual intervention every time the market closes.
Step 4: Build a consistent, auditable dashboard
Many tracking tutorials stop at the backend logic, leaving a major gap when it comes to the final presentation layer. However, the visualization layer is where your data product actually delivers value. You need a dashboard that clearly displays your transformed data and historical trends in an accessible format.
Design your dashboard to provide a high-level overview of portfolio health while allowing users to drill down into specific assets. Use clean charts to highlight trends and summary tables to display current valuations and performance metrics.
Above all, stress the importance of an auditable setup for financial reporting. A high-quality Python stock portfolio tracker must be transparent. If a metric looks unusual, you should be able to trace the logic directly from the final chart back through the calculation steps and down to the raw data extraction.
Unifying the workflow: Building your tracker in Quadratic
Quadratic is the ideal environment to consolidate a fragmented financial API integration and dashboarding process into one unified workspace. Instead of juggling external scripts, databases, and visualization tools, you can build your entire data product in a single platform that serves as a comprehensive software for data analysis. Let’s explore the features of Quadratic in detail.
Pull live stock market data directly into the grid
A robust stock tracker depends on reliable and continuously updated market data. Quadratic allows you to connect directly to stock market data, databases, and live market feeds without building a separate backend infrastructure layer. Using AI-assisted Python generation, you can fetch stock prices, OHLCV data, and company news directly into the spreadsheet environment.
This integration is especially important for long-term investment tracking systems where data integrity directly affects downstream modeling and reporting.
Automate updates without external orchestration tools
One of the largest operational headaches in Python-based tracking systems is maintaining automated refresh pipelines. Traditional workflows often require schedulers and deployment orchestration frameworks like Airflow just to keep dashboards current. Quadratic simplifies this process through its built-in scheduled tasks feature.
Python scripts, live data pulls, calculations, and dashboards can refresh automatically in the background without requiring external infrastructure management. This transforms a static spreadsheet into a continuously updating analytical system capable of functioning as a true financial data product rather than a manually maintained report.
Build custom portfolio analytics with native Python
Traditional spreadsheets quickly become limiting when a stock tracker evolves into a true analytical product. Quadratic bridges this gap by embedding native Python and SQL support directly into the spreadsheet workflow. Analysts can compute rolling volatility, factor exposures, and custom ranking systems without exporting datasets into external BI tools.
This structure is particularly valuable for building reusable portfolio analytics. Instead of relying on static formulas scattered across tabs, you can centralize complex logic into transparent Python workflows that update automatically as new market data arrives.
Use AI to accelerate investment research workflows
Quadratic’s AI capabilities help reduce the operational burden of managing large financial datasets. Analysts can use AI to generate Python scripts for retrieving stock market data, cleaning inconsistent datasets, or building custom screening logic for watchlists.
Beyond spreadsheet automation, the AI layer also enhances Python exploratory analysis. You can ask AI to compare revenue growth trends across sectors or surface anomalies within portfolio holdings. Rather than functioning as a black-box recommendation engine, Quadratic AI operates within a transparent environment where users can inspect and refine every part of the workflow.
Let’s see how this works using the investment portfolio template in Quadratic:
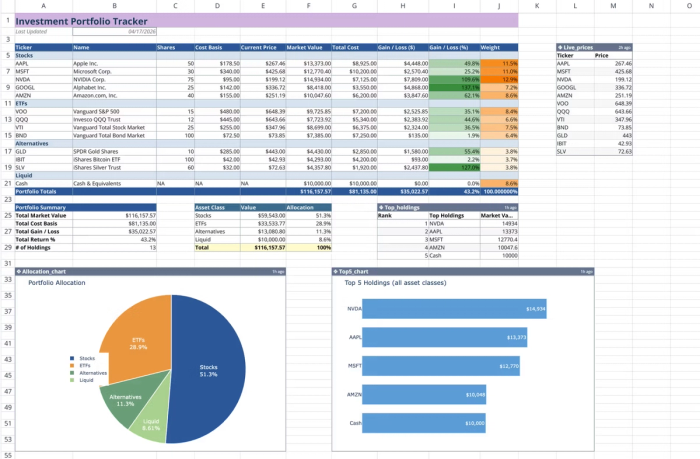
This template combines manual holding data with live market price feeds to create a dynamic tracking environment. By integrating native Python and spreadsheet formulas, it calculates real-time valuations, performance metrics, and asset weights automatically. Users can conduct custom analysis using text prompts:
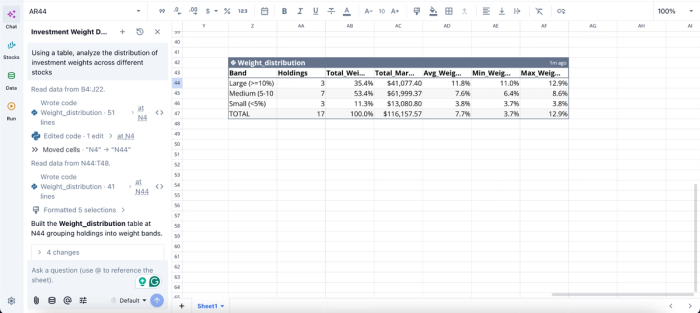
In this image, I prompt Quadratic AI, “Using a table, analyze the distribution of investment weights across different stocks.” It instantly creates a weight distribution table that groups holdings into weight bands. From the table, we can see that the top 3 positions alone account for over a third of total market value, suggesting meaningful single-name concentration risk.
Turn raw market data into dynamic visual dashboards
A repeatable stock tracking workflow requires more than just accurate datasets. Analysts also need a fast way to interpret performance and monitor changing market conditions. Quadratic enables users to build interactive financial data visualization and live charts directly on top of their datasets without exporting data into external visualization tools.
You can visualize portfolio allocation changes, monitor earnings revisions, or overlay news sentiment against price action within the same workspace where the calculations occur.
Visualizations in Quadratic can also be done using text prompts:
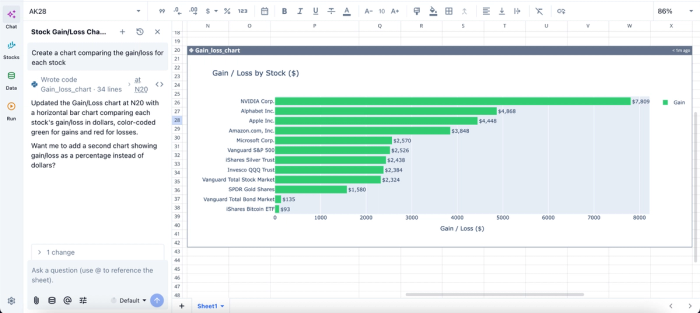
In this image, I ask Quadratic to “Create a chart comparing the gain/loss for each stock.” In seconds, it creates a gain/loss chart that visualizes the gain/loss amount for each stock.
Keep logic, context, and collaboration in one place
As investment workflows scale across teams, maintaining transparency becomes increasingly difficult. Important assumptions often become buried inside isolated scripts or disconnected spreadsheet tabs. Quadratic solves this by keeping data, formulas, Python logic, charts, and collaborative notes centralized within a single environment.
Portfolio managers, analysts, and operations teams can collaborate in real time while maintaining full visibility into how calculations are produced. This improves auditability and ensures that institutional knowledge remains attached directly to the analytical workflow itself.
Conclusion
Treating your stock tracking efforts as a comprehensive data product rather than a disjointed set of scripts is the key to long-term success. By applying ETL best practices and focusing on reliable calculations, you create a system that scales with your needs.
Automation removes the daily burden of manual updates, while a unified presentation layer ensures your data is always reliable and easy to interpret. When you bring the extraction, analysis, and visualization into a single environment, you gain the clarity needed for effective portfolio monitoring. Quadratic allows you to build a Python stock tracker where code, data, charts, and notes live in one auditable file. Try Quadratic for free.
Frequently asked questions (FAQs)
Why do many initial Python stock tracking scripts become difficult to maintain?
Many Python stock tracking scripts fail over time due to fragmentation, relying on isolated files and manual data assembly. This approach makes them hard to maintain as portfolios grow or data sources change. Additionally, they often lack a unified presentation layer, leaving extracted data difficult to audit and use for decision-making.
How does Quadratic enhance the development of a Python stock portfolio tracker?
Quadratic unifies the entire workflow, allowing you to build your Python stock portfolio tracker within a single browser-based environment. It combines native Python execution with a familiar spreadsheet interface, enabling automated data refreshes and background scheduling without complex external orchestrators.
What are the essential steps to build an effective Python stock tracker?
Building an effective Python stock tracker involves defining your ticker universe and reliable data sources, then applying an ETL approach to extract and clean market data. Subsequently, you calculate performance metrics and technical indicators using repeatable Python functions.