
James Amoo, Community Partner
Apr 17, 2026

Many investors start their journey by logging trades and checking balances in traditional spreadsheets like Excel and Google Sheets. While this works initially, these files almost always become fragile and frustrating to maintain as your investments grow. This architecture leads to hidden formula errors and stale data. When you can no longer trust your own tracking system, conducting comprehensive financial data analytics becomes impossible.
Upgrading your stock portfolio tracking spreadsheet is not just about finding a way to get real-time price updates. It requires refactoring the underlying analytics strategy of your document. By separating inputs from outputs and relying on deterministic logic rather than chained cell references, you can build a repeatable and reliable system.
In this guide, you will learn how to automate complex performance calculations, build visual allocation dashboards, and establish a repeatable refresh workflow so your tracker never breaks down again.
Why most portfolio trackers break down
Standard DIY spreadsheets carry inherent risks that compound over time. The most common issues are hidden formula errors that require an Excel formula explainer to untangle, a lack of auditability, and severe scalability limits. When a single misplaced keystroke can alter your total return metric without triggering an error message, the system is fundamentally flawed.
The primary mistake people make when using the best free stock portfolio tracker spreadsheet is mixing raw trade logs directly with visual dashboards and performance math. When you put your data entry rows next to your calculation cells, the spreadsheet quietly breaks as new rows are added or sorted.
Furthermore, relying on basic copy-pasting for Polygon stock data is a recipe for disaster. Manual data entry inevitably leads to out-of-date prices and inaccurate portfolio valuations. If you have to spend an hour updating prices before you can even look at your performance, you are doing the work of a machine.
A reliable system requires automated data processing and a strict structural division between data ingestion and data presentation. Without this separation, your tracker will always be one bad copy-paste away from breaking.
The architecture of a reliable stock portfolio tracker
To fix a messy Excel sheet, you need to refactor it into three distinct layers: inputs, calculations, and dashboards.
This mirrors professional software development principles like separation of concerns. By isolating your raw data from the logic that processes it, you prevent a single formula error from cascading through the entire document. If a dashboard breaks, you know the raw data is still safe.
Setting up this architecture takes a bit of upfront work, but standardization is the absolute key to automation.
Standardizing your holdings schema (inputs)
Your input layer is the foundation of your tracker, often populated via a financial statements API. It should function as a clean and structured dataset that captures every essential detail about your holdings. This layer acts as the single source of truth from which all downstream calculations are derived.
Maintaining strict discipline in this layer is critical. It should contain only manually entered or imported data. By enforcing consistency in how data is recorded, you ensure that aggregation across multiple accounts or asset types remains accurate and predictable.
Automating market data and performance calculations
Once your inputs are standardized, you can transition your calculation layer from basic profit and loss math to professional-grade return calculations.
Many people rely on a basic Google stock portfolio tracking spreadsheet or a generic free online investment stock portfolio tracker spreadsheet to pull simple current prices. However, a reliable system needs to compute advanced metrics accurately. This means differentiating between time-weighted returns (TWR) and money-weighted returns (MWR). TWR measures the compound rate of growth of your underlying investments, while MWR accounts for the size and timing of your cash deposits and withdrawals.
Your calculation layer should also be structured to separate realized gains from unrealized gains. Also, it must include deterministic logic for tracking stock dividend payouts accurately over time.
Building allocation and decision dashboards (outputs)
The output layer is where your data becomes actionable. Dashboards should be designed to pull exclusively from the calculation layer, ensuring that no manual edits or overrides compromise the integrity of the underlying logic. This creates a clear boundary between analysis and visualization, allowing you to trust the insights being displayed.
Beyond basic allocation, you should introduce lightweight decision support views, such as a portfolio backtest. These dashboards help you understand what moved, why it moved, and exactly how much your portfolio has drifted from its target allocation.
Implementing data validation and error controls
A reliable portfolio tracker must include built-in validation mechanisms to ensure the integrity of both inputs and calculations. Without safeguards, simple issues such as incorrect ticker symbols or missing cost basis values can quietly distort your entire analysis. Validation rules help catch these issues at the point of entry before they propagate downstream.
In addition to input validation, error-checking logic should be embedded within the calculation layer to flag inconsistencies in pricing data or mismatched totals. These controls act as a safety net, providing early warnings when something goes wrong and ensuring that your tracker remains dependable even as it scales in complexity.
Establishing a repeatable refresh workflow
Building the spreadsheet is only half the battle; ongoing maintenance dictates whether the tool actually survives. You need to shift your focus to an operational workflow.
Instead of checking and tweaking the sheet randomly every day, define a structured update cadence. Whether you review your portfolio weekly or monthly, stick to a routine that prevents ad-hoc adjustments.
You should also implement a system for snapshotting historical data and versioning the file. This allows you to look back at past performance at specific points in time without overwriting your historical records. Finally, maintain a simple change log within the file to track when you execute major rebalancing moves or make architectural updates to your spreadsheet's logic.
To further strengthen this workflow, establish a clear checklist for each review cycle. This might include verifying that all recent transactions have been recorded, confirming that market data has refreshed correctly. A standardized checklist reduces the risk of oversight and ensures consistency across every update cycle.
Over time, consider introducing light automation to reduce manual effort in the refresh process. Automating data pulls through financial API integration, price updates, or even portions of your reconciliation logic can significantly improve reliability and save time.
How Quadratic upgrades your portfolio tracking
Traditional stock portfolio tracking spreadsheet templates tend to break under complexity. As you layer in more assets, formulas become fragile, and auditability disappears. Quadratic addresses these limitations by transforming your tracker into a dynamic system for financial reporting that combines live data, advanced analytics, and automation in a single environment. Let’s explore these features in detail:
Direct connections to multiple market data sources
Quadratic allows you to pull live stock market data directly into your portfolio tracker, including prices, historical time series, and other relevant financial metrics. This eliminates the need for manual CSV imports or copying data from external platforms, which are common sources of error in traditional spreadsheets.
By maintaining live connections, your portfolio tracker always reflects the most current market conditions. This ensures that performance calculations and risk metrics remain accurate without requiring constant manual refreshes.
Automated refresh and background execution
One of the most significant features is the ability to automate your investment portfolio spreadsheet workflow. Quadratic allows you to schedule your tracker to refresh automatically, updating market data, recalculating metrics, and refreshing dashboards without manual intervention.
This transforms your tracker into a continuously running system rather than a static file. You no longer need to remember to update your spreadsheet, and you can trust that your data is always up to date.
Reusable portfolio templates
Quadratic enables you to build reusable templates that can scale as your portfolio grows. Whether you are adding new asset classes or analytical metrics, your tracker can adapt without requiring a complete rebuild.
This ensures that your system remains robust over time. Instead of outgrowing your spreadsheet, you continuously evolve it into a more powerful and reliable financial tool.
AI for stock market analysis
Quadratic integrates AI into the analytical layer of your tracker, enabling you to generate advanced calculations such as time-weighted returns, money-weighted returns, and risk-adjusted metrics with minimal effort. Instead of manually constructing complex formulas, you can define your analytical goals and let AI agents for data analysis generate the required logic.
This significantly reduces the risk of formula errors while allowing you to implement more sophisticated performance models. As your portfolio evolves, you can quickly adapt your analysis without rebuilding your spreadsheet from scratch.
Let’s see how this works using Quadratic’s stock analysis template. Here:
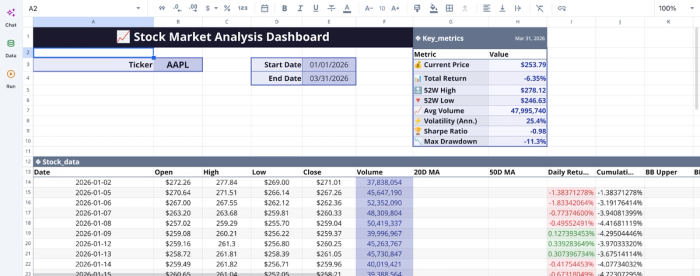
From the dashboard, we can gain more insights into stocks by simply asking questions via text prompts. Here:
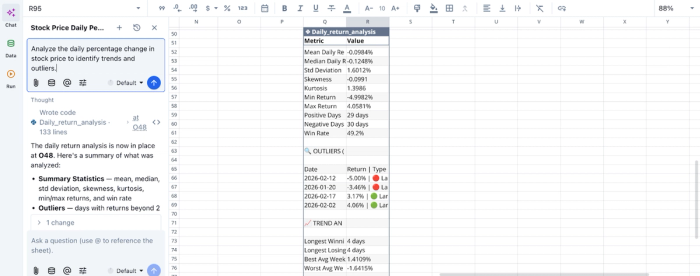
Here, I ask Quadratic AI to “Analyze the daily percentage change in stock price to identify trends and outliers”. It instantly creates a table that shows insights into daily returns, using metrics like mean daily return, skewness, and kurtosis. It also gives insights into trend analysis and outlier data.
AI data visualization
Quadratic enables you to create dynamic financial data visualizations that automatically update based on your underlying data. You can visualize portfolio performance, allocation breakdowns, and historical trends directly within the same environment where your data is stored and processed.
These visualizations are tightly coupled with your calculations, ensuring consistency between what you see and the underlying logic. This makes it easier to identify trends and make informed decisions.
Let’s see how we can create visualizations in Quadratic:
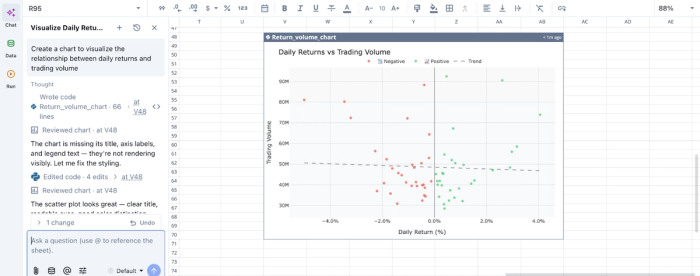
In this image, I ask Quadratic to “Create a chart to visualize the relationship between daily returns and trading volume”. It instantly creates a scatter plot that gives insight into daily returns vs trading volume.
Native support for programming languages
With built-in support for Python and SQL, Quadratic allows you to move beyond the limitations of traditional spreadsheet logic. You can implement scalable calculations without depending on long chains of fragile cell references.
This is particularly valuable for portfolio tracking, where advanced logic is often required to handle dividends and performance attribution. By consolidating all logic into a single environment, you improve both reliability and maintainability.
Collaboration and shared portfolio insights
Quadratic supports real-time collaboration, enabling multiple users to view, edit, and validate the same portfolio tracker. This is especially useful for investment teams or individuals managing shared accounts.
With version history and change tracking, every update is recorded, creating a transparent workflow. Through this collaborative analytics platform, all stakeholders can understand how the portfolio evolves and verify the logic behind key decisions.
Build your automated portfolio tracker today
Upgrading your tracker ultimately comes down to treating it like professional softwares for stock market analysis. By separating your raw inputs from your calculations, automating your data quality checks, and using robust logic instead of fragile formulas, you protect your data from quiet corruption.
A trustworthy spreadsheet gives you the confidence to make better, faster rebalancing decisions without second-guessing your own math. Quadratic allows users to build a stock portfolio tracking spreadsheet that pulls market data and powers dashboards automatically. Try Quadratic for free.
Frequently asked questions (FAQs)
What is the recommended architecture for a reliable stock portfolio tracking spreadsheet?
The article recommends refactoring your stock portfolio tracking spreadsheet into three distinct layers: inputs, calculations, and dashboards. This separation of concerns ensures that raw data remains clean, calculations are deterministic, and visual outputs are derived without altering underlying logic.
How can I ensure data quality and avoid errors in my stock portfolio tracker spreadsheet?
To ensure data quality in your stock portfolio tracker spreadsheet, implement automated validation checks that flag missing prices or duplicate tickers. Establishing a repeatable refresh workflow and maintaining a change log also helps protect your calculations from silent corruption and ensures your data stays accurate.
How does Quadratic help upgrade a standard stock portfolio tracking spreadsheet?
Quadratic improves upon a standard stock portfolio tracking spreadsheet by combining a familiar grid with native Python, SQL, and formulas, allowing for deterministic logic instead of fragile cell references. It offers built-in stock market data access and automation to keep data and dashboards updated automatically, making it easier to build the best stock portfolio tracking spreadsheet without manual refreshes.