James Amoo, Community Partner
Apr 30, 2026

Table of contents
- Why traditional investment portfolio spreadsheets break down
- Core components of a modern investment tracker
- How to build an automated investment portfolio spreadsheet
- The best way to track an investment portfolio with Quadratic
- Grab your investment portfolio spreadsheet template
- Frequently asked questions (FAQs)
Managing personal investments should not require daily manual updates or spending hours fixing broken formulas. For many individual investors and analysts, keeping track of assets across different brokerage accounts quickly becomes a frustrating chore.
The core problem is that a traditional investment portfolio tracker relies on fragile workarounds and manual data exploration. Every time the market moves or you make a new trade, you are forced to copy and paste new values, adjust cell references, and hope your underlying logic holds together. This turns what should be a tool for financial reporting into a high-maintenance burden.
Quadratic provides an investment portfolio spreadsheet that combines real-time data integration, Python-powered analysis, and flexible spreadsheet workflows in one environment. In this blog post, you’ll learn the limitations of traditional portfolio trackers, the key components of a modern investment dashboard, and how to build a fully automated system that gives you real-time insights into your portfolio performance.
Why traditional investment portfolio spreadsheets break down
Traditional spreadsheet tools like Excel and Google Sheets were built for static accounting, not for handling live financial data. When you try to force stock data in Excel to act like a real-time application, the cracks quickly begin to show.
In standard setups, users often rely on complex VBA macros or manual "Refresh All" buttons to pull in new prices. These methods are notoriously unstable. Macros can break with a single software update, and manual refreshes often lead to stale data if you forget to click them. This leaves you staring at an investment portfolio tracking spreadsheet that no longer reflects reality.
Maintaining complex formulas for performance tracking over time is another major challenge. As you add new assets, your formula ranges need constant adjustment. A single missed cell reference can cascade through your entire document.
Finally, manual data entry introduces a high risk of human error. Typing in the wrong ticker symbol or misplacing a decimal point in stock market analysis can drastically skew your portfolio performance metrics, leading to misguided financial decisions.
Core components of a modern investment tracker
To build a reliable system, you need to start with the right foundation. Every effective stock portfolio tracker requires a few essential structural elements to function properly and provide actionable insights.
First, you need a clear asset allocation calculator and account categorization. A modern tracker should organize your holdings by asset class, sector, and account type. This structure gives you a clear overview of everything you own, making it easier to spot imbalances.
Next, you need robust performance calculations. A complete tracker goes beyond simple current value. It must calculate profit and loss (P&L) for individual positions and the overall portfolio, expected returns based on historical data, and standard deviation to measure portfolio volatility and risk.
These components must be dynamic rather than static. If your expected returns or P&L metrics require manual updates, they will quickly fall out of sync with the market. Dynamic components ensure that your tracker always provides an up-to-date picture of your financial health, which is the best way to track investment portfolio performance over time.
How to build an automated investment portfolio spreadsheet
Setting up a low-maintenance, automated investment tracking spreadsheet is entirely achievable with a step-by-step workflow. The goal here is to build a hands-off system that updates itself, minimizing your manual effort while maximizing data accuracy and reliability.
Here is how to construct an investment portfolio spreadsheet that does the heavy lifting for you.
Step 1: Automating market data retrieval
The first step to automation when tracking stock is eliminating manual data entry for stock prices. You need to pull live and historical stock data directly into the sheet.
For broader asset coverage of historical stock data, Quadratic provides direct access to real-time stock market data within the spreadsheet. This automated data flow is what separates a modern tool from a basic free online investment stock portfolio tracker spreadsheet. It provides a data layer where your portfolio values update continuously in the background, ensuring your tracker always reflects current market conditions.
Step 2: Streamlining performance calculations
Once your market data is flowing automatically, you need to streamline your performance calculations and financial data analytics. This involves setting up logic to automatically calculate key metrics like your daily P&L, total return, expected returns, and risk metrics.
The golden rule here is to avoid hardcoding values. Always use dynamic formulas that recalculate instantly as new market data flows in. Keep your focus on evaluating portfolio health and generating actionable insights. With Quadratic, you can combine spreadsheet formulas with Python-based calculations, enabling more advanced analytics without sacrificing flexibility. This allows you to maintain an automated workflow while focusing on evaluating portfolio health and generating actionable insights.
Step 3: Creating dynamic asset allocation dashboards
Raw numbers are difficult to interpret at a glance, which is why visual dashboards are essential. Charts such as a pie chart showing target versus actual asset allocation, or a line chart tracking portfolio value over time, provide immediate clarity.
Quadratic enhances this step by enabling dynamic financial data visualizations directly within your workflow. As your data updates, your charts and dashboards update automatically, giving you a live view of portfolio performance.
The best way to track an investment portfolio with Quadratic
Using a stock tracking spreadsheet is often where most investors start, but it’s also where most systems begin to break down. Quadratic addresses this by turning portfolio tracking into a fully automated workflow that stays continuously up to date without manual intervention. Let’s explore the features of Quadratic in detail.
Connect live market data, broker feeds, and financial APIs
Quadratic allows you to pull in live market prices, historical OHLC data, and portfolio holdings directly into your spreadsheet using built-in data functions and external API connections. This removes the need for manual CSV downloads or fragmented data sources.
By unifying brokerage data and external financial datasets—such as comparing Alpha Vantage vs Finnhub—in one place, your portfolio tracker becomes a single source of truth. Every asset update flows directly into your model without additional setup or maintenance.
Build a fully automated portfolio model with no manual refreshes
Once your data is connected, Quadratic enables full automation of your portfolio calculations. Position values, returns, allocations, and performance metrics update automatically as new data arrives.
This eliminates the need for repetitive spreadsheet maintenance. Your portfolio tracker behaves like a live financial system rather than a static document.
Compare holdings against benchmarks and market indices
Quadratic makes it easy to benchmark your portfolio against indices like the S&P 500 or sector-specific ETFs by pulling fundamental and technical data into the same workspace.
This enables true performance attribution analysis. You can clearly see whether gains are driven by allocation decisions or broader market movements.
Run advanced portfolio analytics with Python and financial models
Quadratic includes native Python and SQL support, enabling you to build sophisticated investment models directly inside your spreadsheet. You can calculate volatility, Sharpe ratios, covariance matrices, and other advanced risk metrics using yfinance alternatives.
This makes it possible to implement institutional-grade analysis without leaving your spreadsheet environment. Your portfolio tracker evolves into a quantitative research tool.
Use AI to analyze performance, risk, and allocation patterns
Quadratic’s AI capabilities allow you to go beyond basic returns tracking and implement machine learning for stock selection. You can ask it to evaluate portfolio diversification, identify overexposure, or summarize performance across time periods and asset classes.
It can also highlight hidden risks such as concentration in specific sectors or underperformance relative to benchmarks, turning your spreadsheet into an active investment analyst. Let’s see how this works using the investment portfolio template in Quadratic:
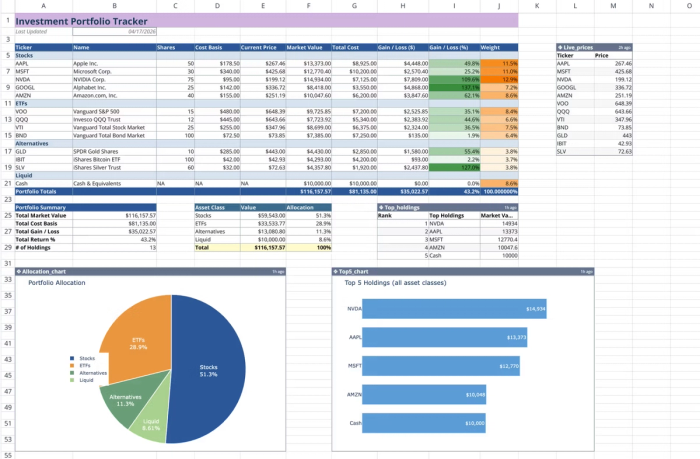
This template combines manual holding data with live market price feeds to create a dynamic tracking environment. By integrating native Python and spreadsheet formulas, it calculates real-time valuations, performance metrics, and asset weights automatically. You can also perform advanced analytics by using text prompts:
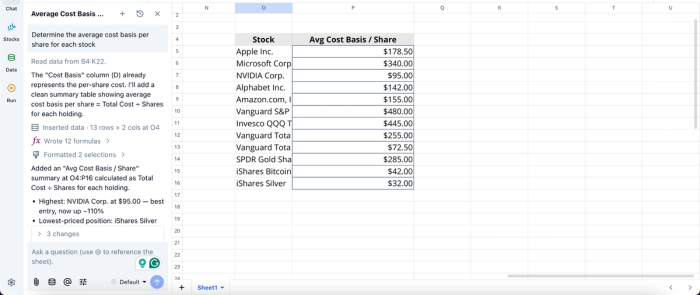
In this image, I ask Quadratic AI to “Determine the average cost basis per share for each stock.” It instantly generates a table that shows all the stocks in my portfolio and the corresponding average cost per share.
Visualize portfolio performance with real-time dashboards
Quadratic allows you to build interactive dashboards that visualize portfolio allocation, historical returns, drawdowns, and sector exposure. These visuals update automatically as your data changes.
This gives you immediate clarity into portfolio behavior. Instead of interpreting raw numbers, you can monitor trends and performance shifts at a glance. Visualization in Quadratic can also be done by using text prompts:
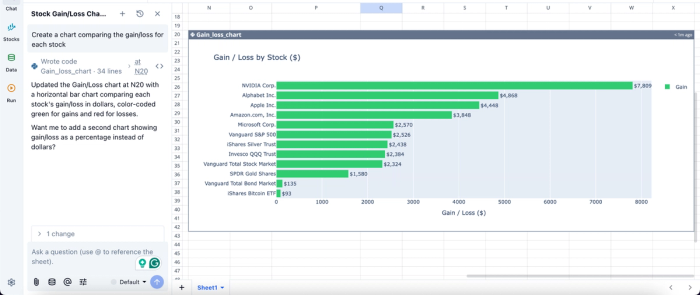
In this image, I ask Quadratic AI to “Create a chart comparing the gain/loss for each stock.” It instantly generates a customizable chart that displays the Gain/loss by stock, allowing analysts to easily gain insights into their investment portfolio.
Collaborate on shared investment strategies
Quadratic supports real-time collaboration, allowing multiple users to analyze and modify the same portfolio model simultaneously. This is useful for investment clubs, partners, or advisory workflows.
Everyone works from a single version of the truth, ensuring consistency in analysis and decision-making without file duplication or version conflicts.
Grab your investment portfolio spreadsheet template
Moving from a manual, high-maintenance tracker to a fully automated system fundamentally changes how you manage your assets. An automated setup saves significant time, reduces costly data entry errors, and provides much better visibility into your overall asset performance.
Quadratic provides a reliable investment portfolio spreadsheet template that allows you to duplicate a proven layout, customize it for your specific holdings, and immediately start analyzing your assets. Whether you are looking for a free Excel investment portfolio spreadsheet alternative or a modern cloud-based template, starting with a structured foundation saves hours of formatting. Try Quadratic for free.
Frequently asked questions (FAQs)
What is the best way to track an investment portfolio reliably?
The best way to track an investment portfolio involves leveraging automation for live market data, streamlining performance calculations with dynamic formulas, and creating visual dashboards. This approach ensures your investment portfolio tracking spreadsheet provides up-to-date insights without constant manual effort.
How does Quadratic help automate an investment portfolio spreadsheet?
Quadratic streamlines your investment portfolio spreadsheet by integrating built-in STOCKHISTORY formulas with AI-generated Python for richer financial data and complex calculations. It allows direct connections to live databases and APIs, and its scheduling features keep your data and dashboards automatically updated.
Can I use an investment portfolio spreadsheet template to get started?
Yes, using an investment portfolio spreadsheet template is an excellent way to accelerate building your automated tracking system. Templates provide a structured foundation that helps you adopt data organization best practices, allowing you to quickly customize and analyze your holdings without building from scratch.