James Amoo, Community Partner
Apr 17, 2026

The sheer volume of predictive analytics software tools on the market today is overwhelming. From dedicated forecasting tools to complex fundamental screeners, investors and finance teams are constantly bombarded with options promising a competitive edge.
However, success in the markets rarely comes from chasing disjointed tools. Instead, it requires carefully aligning your software with your actual research workflow. When evaluating softwares for stock market analysis, the goal should be to create a unified analysis layer. This approach prevents data silos and ensures that your research is reliable and easy to verify. In this guide, we’ll explore how to leverage the best software tools for stock market analysis.
The core challenge: Fragmented data in financial research
Investors and finance teams routinely rely on a highly fragmented stack of tools. A typical workflow might involve one application for screening equities, another for charting price action, and a traditional spreadsheet like Excel or Google Sheets for building valuation models.
While each tool might excel at its specific job, this fragmentation creates significant operational challenges. Data silos form quickly, leading to stale data and constant integration bottlenecks between platforms.
The most common workaround is manual copy-pasting. Moving data between screeners, charting apps, and spreadsheets breaks the underlying logic. When formulas disconnect from their original data sources, it leads to unreliable financial reporting and a fragile research process where errors easily go unnoticed.
Beyond data integrity issues, fragmentation also undermines analytical consistency. Different tools often rely on varying data definitions and calculation methodologies, which can result in conflicting outputs for the same metric. This makes it difficult to establish a single source of truth, forcing analysts to spend additional time reconciling discrepancies instead of generating insights.
Furthermore, fragmented workflows limit auditability and reproducibility. When data transformations occur across multiple disconnected systems, it becomes nearly impossible to trace how a final output was derived. This reduces confidence in decision-making, particularly in collaborative environments where transparency and accountability are essential.
Categorizing stock market analysis software by primary function
To build a better workflow, it helps to break down the landscape of financial software based on the specific jobs they perform.
Understanding these distinct categories allows you to build a modular and customized tool stack rather than relying on a one-size-fits-all solution. Finding the best software for stock market analysis means matching the tool's primary function to your daily research needs.
Technical analysis software (charting and indicators)
Charting software is designed to visualize price action, trading volume, and market momentum over specific timeframes.
Since technical analysis principles apply globally, traders need tools capable of handling diverse datasets. Whether you are trading US equities or searching for the best technical analysis software for Indian stock market data, the core requirements remain the same.
The best technical analysis software for stock market research provides robust support for custom indicators and reliable real-time data feeds, allowing traders to execute strategies based on accurate price movements.
Fundamental analysis and screening tools
When comparing fundamental analysis vs technical analysis, fundamental tools evaluate the intrinsic value of an asset. They provide access to company financials, SEC filings, earnings reports, and macroeconomic indicators.
Understanding the difference between a stock scanner vs screener plays a critical role in this process. They help users filter the broader market down to a manageable watchlist, and many analysts even create a stock screener with Python based on specific valuation metrics, such as price-to-earnings ratios, debt levels, or revenue growth. Without reliable historical inputs, building dependable valuation models is impossible.
Portfolio tracking and management
Once research turns into an active position, a robust stock portfolio tracking spreadsheet or management software takes over. These tools, often including a dedicated portfolio rebalancing tool, are used to monitor open positions and manage overall portfolio risk.
The defining feature of a strong portfolio tracker is seamless data integration. Direct connections to brokerages and financial institutions are necessary to keep portfolio metrics up to date without constant manual data entry.
Matching software choices to investor personas
The ideal software stack varies significantly depending on the user. Holding periods, financial goals, and technical expertise all dictate which tools belong in your workflow. Different personas naturally prioritize specific features, requiring different approaches to software selection.
Retail investors and day traders
Retail investors and active day traders prioritize accessible interfaces, speed of execution, and cost-effective data feeds.
These users often look for platforms that bundle basic screening and charting functionalities without requiring expensive institutional licenses. For those just starting or working with smaller accounts, finding the best free software for stock market analysis is often a top priority to keep overhead costs low while still accessing essential market data.
Analysts and finance teams
Institutional users, such as financial analysts and business teams, have much stricter requirements. They need tools that support deep research, custom modeling capabilities, and rigorous reporting standards.
Finance teams require software that can handle complex logic, extensive historical backtesting, and collaborative workflows. For these professionals, simple SQL charting is not enough; they need an environment where multiple stakeholders can review, edit, and validate the underlying data together.
Long-term investors and portfolio managers
Long-term investors and portfolio managers prioritize depth of insight over speed. Their focus is on evaluating company fundamentals and making strategic allocation decisions over extended time horizons.
For this persona, software that supports portfolio tracking and scenario analysis is essential. Integration with financial statements and economic indicators allows them to build and maintain conviction in their positions while continuously reassessing portfolio health.
Quantitative analysts and data-driven investors
Quantitative analysts and data-driven investors require highly flexible environments that can support advanced statistical modeling, machine learning for stock selection, and quantitative data analysis. Their workflows often involve large datasets and backtesting frameworks that go far beyond standard charting or screening tools.
These users prioritize software that supports programming languages like Python or SQL, offers robust data integration through yfinance alternatives, and enables the creation of repeatable pipelines. The ability to test strategies across historical data and iterate quickly is critical.
Bridging the gap: How Quadratic fits your analysis workflow
Modern stock market analysis is often slowed down by fragmented tools and manual workflows that are difficult to audit. Quadratic addresses these challenges by providing a unified environment where investors can conduct both technical and fundamental analysis in a single system. Let’s explore the features of Quadratic in detail:
Direct connections to multiple data sources
In addition to the ability to download historical stock data using the STOCKHISTORY formula, Quadratic allows seamless integration with financial data providers, APIs, and databases, enabling users to pull real-time stock market data directly into the workspace. Instead of switching between platforms, analysts can centralize all relevant inputs.
This eliminates data silos and ensures consistency across analyses. With live connections, datasets remain up to date, reducing the risk of working with stale or misaligned information. As a result, users can build more reliable models and maintain a single source of truth for all research activities.
Templates
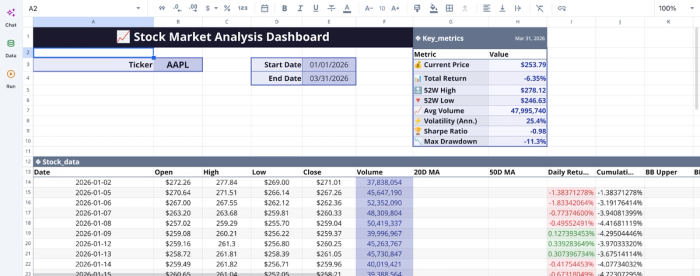
Users can create standardized templates for stock analysis, including predefined data pipelines, calculations, and visualizations. These templates can be reused across multiple use cases, ensuring consistency in methodology. Quadratic comes with a stock market analysis template with features like real-time data visualization, price trend analysis, and technical indicator calculations.
Over time, this reduces repetitive setup work and allows analysts to focus on interpretation rather than rebuilding models. It also enforces best practices, making research processes more structured and reliable.
AI data analysis
Quadratic’s built-in AI capabilities significantly accelerate the analytical process. Users can leverage AI agents for data analysis to generate Python code, financial models, or custom calculations on demand.
For stock market analysis, this means you can quickly evaluate companies, identify trends, or test hypotheses without writing complex logic from scratch. AI acts as a force multiplier, reducing manual effort while improving analytical depth and consistency across workflows.
Let’s see how this works. We’ll use Quadratic’s stock market analysis template. Here:
While this template provides several insights out of the box, users can still ask questions on areas where they need more insights. For example, we can get insights into periodic changes in the stock price. Here:
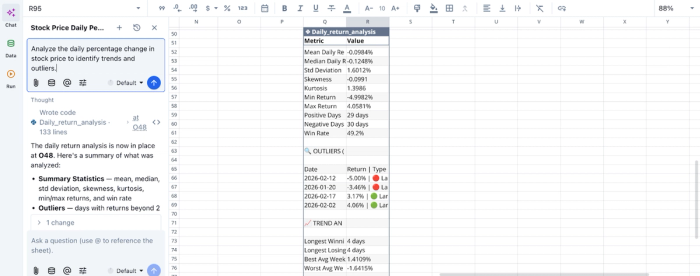
In this image, I asked Quadratic AI to “Analyze the daily percentage change in stock price to identify trends and outliers.” It generated a table showing insights into the outliers, trend analysis, and a general summary.
AI data visualization
Effective decision-making requires a clear interpretation of data, and Quadratic enables users to create dynamic financial data visualizations directly from live datasets. Charts, dashboards, and comparative analyses can be generated within the same environment.
This ensures that visualizations are always accurate and up to date. Whether tracking price trends or analyzing portfolio performance, users can interact with real-time visuals that reflect the latest market conditions. Let’s see how we can create visualizations in Quadratic:
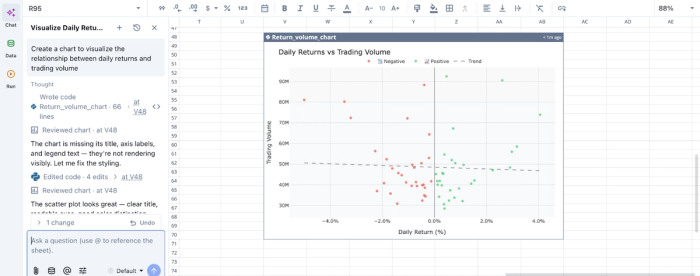
In this image, I prompt Quadratic AI to “Create a chart to visualize the relationship between daily returns and trading volume”. In seconds, it created a scatter plot based on the prompt. If the specific chart type isn’t stated in your prompt, Quadratic intelligently picks the most appropriate chart type for visualization based on your dataset.
Native support for programming languages
Quadratic supports Python, SQL, and spreadsheet formulas within a single interface, allowing users to perform advanced SQL data analysis without leaving the platform. This is particularly valuable for building custom financial models or backtesting trading strategies.
By combining multiple analytical paradigms, users can tailor their workflows to specific needs. This flexibility ensures that both simple calculations and complex models can coexist within the same system.
Collaboration and shared research workflows
Stock market analysis is often collaborative, especially within teams or investment groups. Quadratic enables real-time collaboration, allowing multiple users to work on the same datasets, share insights, and refine models together.
Version control and change tracking ensure transparency, making it easy to audit how analyses evolve. This improves accountability and ensures that all stakeholders are aligned on data and conclusions.
Conclusion
Moving away from fragmented tools is essential for modern financial research. An integrated and auditable workflow reduces errors and provides much-needed transparency across your data.
The right software setup should seamlessly bridge the gap between raw data and actionable financial insights. By consolidating your softwares for stock market analysis into a single environment, you ensure that your logic and outputs remain intact and easy to verify.
Quadratic allows you to build your research workflow in a single environment that contains your data, analysis, charts, and models. Try Quadratic for free.
Frequently asked questions (FAQs)
What are the main categories of softwares for stock market analysis?
Softwares for stock market analysis typically falls into three primary categories: technical analysis tools for charting and indicators, fundamental analysis screeners for intrinsic value assessment, and portfolio management software for tracking positions and risk. Each category serves distinct functions to support different aspects of financial research.
How does Quadratic enhance the process of stock market analysis?
As a modern MarketXLS alternative, Quadratic acts as a unified layer, integrating analysis and visualization within a single browser-based spreadsheet environment. It provides direct access to historical market data and allows users to combine Python, SQL, and standard formulas to build custom, auditable models. This approach simplifies complex tasks and helps users move from raw data to insights more efficiently.
What should users consider when looking for the best technical analysis software for stock market research?
When seeking the best technical analysis software for stock market research, users should prioritize robust charting capabilities, comprehensive support for custom indicators, and reliable real-time data feeds. These features ensure accurate visualization of price action and market momentum.