James Amoo, Community Partner
Apr 17, 2026

For decades, the financial world has long debated fundamental analysis vs technical analysis. Fundamental analysts dive deep into financial reporting to assess intrinsic value, while technical traders focus on price patterns and market momentum. In reality, effective investing is about combining both perspectives to build a more solid data infrastructure and analytics strategy.
Think of it as a clear division of labor. Fundamentals dictate what to buy, while technicals dictate when to buy. This guide explores the definitions and limitations of both methods, showing you how technical vs fundamental analysis can work together in a practical workflow.
Understanding fundamental analysis
At its core, fundamental analysis is the process of evaluating a company's intrinsic value and its long-term business potential. Investors using this approach look closely at financial statements, macroeconomic factors, and overall industry health to determine if a stock is priced fairly.
Common methodologies include computing valuation ratios to assess a company's financial stability and projecting future earnings growth, often employing sophisticated intrinsic value calculation methodologies like discounted cash flow. When comparing fundamental analysis vs technical approaches, the focus here is entirely on the underlying business rather than the stock's current momentum.
The primary strength of this approach is its ability to build long-term conviction in your analytics strategy. By thoroughly conducting financial data analytics, you can avoid structurally flawed businesses and focus on high-quality assets. However, the main limitation is timing. A company's intrinsic value can take years to be accurately reflected in its stock price. This delay often leads to a common pitfall known as a value trap.
Another critical advantage of fundamental analysis is its ability to incorporate qualitative factors that are not immediately visible in financial statements. Elements such as management quality, competitive positioning, brand strength, and regulatory environment can significantly influence long-term performance. Investors who incorporate these dimensions alongside quantitative data analysis are better positioned to identify durable businesses.
Understanding technical analysis
While fundamentals look at the business, technical analysis studies historical price action and trading volume to forecast future market movements. The goal is to optimize entry and exit points by identifying short-term trends, market momentum, and key support or resistance levels.
This discipline relies heavily on visual tools and metrics, such as price charts, moving averages, and other elements of predictive analytics. When weighing technical analysis vs fundamental approaches, remember that technicals ignore the balance sheet and focus entirely on how market participants are behaving right now.
Despite these strengths, charting has clear limitations. The frequency of false signals in charting can be high, and the reliance on short-term patterns often introduces psychological biases that lead to over-trading. Furthermore, technical charts cannot predict sudden macroeconomic shocks or unexpected earnings misses. A perfect chart setup can easily be undone by a negative news headline.
Another key benefit of technical analysis is its adaptability across different time horizons and asset classes. Whether applied to intraday trading, swing trading, or long-term trend analysis, the same core principles can be adjusted to fit varying strategies.
Fundamental analysis vs technical analysis: which is better?
Pure fundamentals require a demanding patience as the market slowly realizes a company's true value. In contrast, technical trading is tactical and shorter-term, focusing on immediate price action. In this section, we’ll compare technical analysis and fundamental analysis using different criteria.
Time horizon and investment style
Fundamental analysis is best suited for long-term investing horizons. It focuses on identifying undervalued companies with strong growth potential and holding them through market cycles. This approach aligns with strategies such as value investing or growth investing, where returns are realized over months or years rather than days or weeks.
Technical analysis, on the other hand, thrives in shorter timeframes. It is designed for traders who aim to capitalize on price movements over days, weeks, or even minutes. By analyzing trends and momentum using forecasting software, technical traders can enter and exit positions quickly, making it more appropriate for active trading strategies.
In essence, fundamentals answer “what to hold over time,” while technicals answer “when to act,” making them complementary rather than competing approaches.
Data inputs and methodology
Fundamental analysis relies on structured financial and economic data, including income statements, balance sheets, cash flow statements, and macroeconomic indicators. It involves deep analytical work, often combining quantitative modeling with qualitative assessments such as management quality or industry positioning.
Technical analysis uses market-generated data. Its methodology is rooted in pattern recognition, statistical indicators, and chart-based analysis. Rather than evaluating business performance, it interprets how market participants are reacting in real time.
While fundamentals provide depth and context, technicals provide immediacy and responsiveness.
Decision-making and timing precision
Fundamental analysis offers strong conviction but limited timing precision. An investor may identify a stock as undervalued, but the market can remain irrational longer than expected. This often results in delayed entries or prolonged holding periods before value is realized.
Technical analysis excels at timing decisions. By identifying entry and exit points through indicators like support/resistance or moving averages, it allows traders to act with greater precision. This is particularly useful in volatile markets where timing can significantly impact returns.
Risk management and downside protection
Fundamental analysis manages risk primarily through selection, choosing financially strong companies with sustainable business models. Diversification and margin of safety principles are often used to mitigate downside risk over the long term.
Technical analysis provides more active risk management tools. Traders can set stop-loss orders and exit positions quickly when market conditions change. This makes it especially effective in limiting short-term losses.
Adaptability to market conditions
Fundamental analysis can struggle in rapidly changing or highly speculative markets where price movements are driven more by sentiment than intrinsic value. In such environments, strong fundamentals may not immediately translate into stock performance.
Technical analysis is inherently adaptive to market conditions because it focuses on price behavior. It can capture trends in bullish, bearish, or sideways markets, making it more flexible in the face of changing sentiment and volatility.
However, relying solely on technicals without understanding the underlying value can lead to chasing trends without context. Combining both ensures adaptability without losing sight of long-term fundamentals.
Complexity and learning curve
Fundamental analysis requires a deep understanding of financial statements, valuation models, and industry dynamics. It often involves significant research and analytical effort, making it more time-intensive but also more grounded in business reality.
Technical analysis, while conceptually simpler to start, has its own complexity in mastering indicators and market psychology. The abundance of tools and signals can lead to overcomplication or misuse without disciplined frameworks.
Building a unified research workflow in Quadratic
A common pain point for investors is the fragmentation of their research process. Financial statements live in one tool, price charts in another, and analysis in static spreadsheets. This c increases the risk of errors and makes it difficult to maintain a coherent investment thesis. Quadratic addresses this gap by providing a single environment where both fundamental and technical analysis can coexist seamlessly. Let’s explore the features of Quadratic in detail:
Direct connections to multiple data sources
Quadratic integrates directly with external data sources such as financial APIs, databases, and raw data. For technical analysis, functions such as STOCKHISTORY enable you to retrieve historical price series and trading volume directly into the grid for immediate analysis. Users can also pull live data using its robust stock market data connection.
On the fundamental side, you can leverage Quadratic’s Plaid integration to connect to financial datasets containing income statements, balance sheets, and cash flow data without relying on manual downloads. This eliminates inconsistencies and enables a more reliable research foundation.
Customizable and reusable research templates
Quadratic allows users to create reusable templates for asset analysis, including predefined data pipelines, calculations, and visualizations. These templates can standardize your research process, ensuring consistency across different investments.
Over time, this reduces setup overhead and improves efficiency. Instead of rebuilding models from scratch, you can apply proven frameworks to new opportunities, accelerating your analysis while maintaining methodological rigor.
AI-powered data analysis
Quadratic’s built-in AI assistant transforms how investors perform analysis by generating code and insights on demand. You can prompt the AI to compute valuation ratios, run discounted cash flow models, or screen for companies based on specific financial criteria.
This capability is equally valuable for technical workflows. AI agents for analysis can help identify trends or highlight anomalies in price data. By automating repetitive analytical tasks, Quadratic allows investors to focus on interpretation and decision-making rather than manual computation. Let’s see how this works:
We’ll be using a sample fundamental analysis template provided by Quadratic. Here:
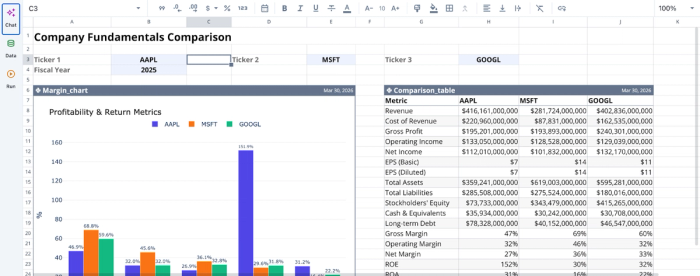
This image shows a comparison template between three tickers. Suppose I want to evaluate the financial health of each company:
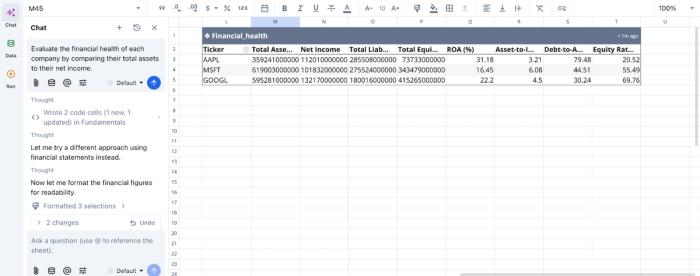
Here, I asked Quadratic to “Evaluate the financial health of each company by comparing their total assets to their net income.” It generates a table that gives insights into several metrics for all the tickers, including the total equity, ROA, and equity ratio.
AI data visualization
Financial data visualization is critical when combining technical and fundamental insights. Quadratic enables users to generate charts, dashboards, and comparative visuals directly from live data. This makes it easy to analyze trends and performance metrics.
For example, you can overlay price movements with key financial indicators or visualize valuation multiples across a peer group. These dynamic visualizations update automatically as data changes, ensuring that your insights remain current and actionable without requiring manual refreshes. Visualizations in Quadratic can be done using simple text prompts. Here:
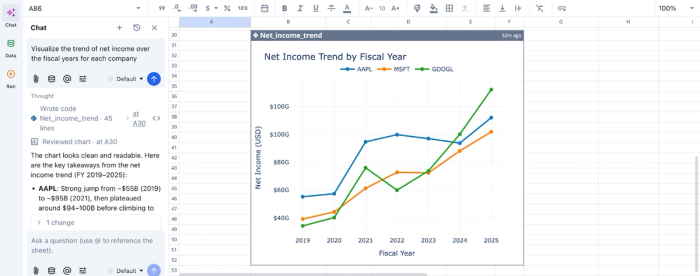
In this image, I ask Quadratic AI to “Visualize the trend of net income over the fiscal years for each company”. In seconds, it creates a chart that gives visual insights into the net income trend by fiscal year.
Native support for programming languages
Quadratic supports Python and SQL within the same interface, enabling advanced AI data modeling and spreadsheet analysis without leaving the platform. This is particularly powerful for investors who want to build custom valuation models or perform time-series analysis.
With Python, you can implement sophisticated financial models or statistical techniques, while SQL for data analysis allows for efficient database analytics of large datasets. This ensures that your workflow can scale in complexity as your analytical needs grow.
Collaboration
Investment research is often a collaborative effort, especially in teams or investment groups. Quadratic provides a collaborative analytics platform that allows multiple users to work on the same dataset.
Built-in version control and change tracking ensure that every update is documented, making it easy to review past assumptions and maintain accountability.
Conclusion
The relationship between fundamental analysis and technical analysis is highly complementary. While one tells you the quality of the asset, the other tells you the reality of the market.
Combining intrinsic value assessments with precise market timing creates a more robust and resilient investment framework. You no longer have to choose sides in the debate. Quadratic allows you to combine fundamentals and technical research sheets using formulas, code, and AI from a single environment. Try Quadratic for free.
Frequently asked questions (FAQs)
What is the primary difference between fundamental analysis vs technical analysis?
Fundamental analysis focuses on a company's intrinsic value and long-term potential by evaluating financial statements and macroeconomic factors. In contrast, technical analysis studies historical price action and trading volume to predict short-term market movements and identify optimal entry and exit points. Essentially, fundamentals determine "what to buy," while technicals determine "when to buy."
Which approach is more effective: Technical analysis vs fundamental analysis?
Neither fundamental analysis nor technical analysis is inherently superior on its own; their effectiveness depends on an investor's time horizon and goals. The article suggests that a blended confluence approach that integrates both methods is often the most robust strategy.
How can investors effectively combine fundamental vs technical analysis in their workflow?
A practical approach involves starting with fundamental analysis to build a curated watchlist of financially sound companies. Investors then apply technical analysis exclusively to this list to pinpoint mathematically optimal entry and exit prices. This strategy ensures investments are made in high-quality assets at opportune market moments.
How does Quadratic assist in blending fundamental analysis vs technical analysis?
Quadratic unifies both analytical disciplines into a single AI spreadsheet, addressing the challenge of consolidating financial data and price charts. It allows users to pull price series and charting data for technical analysis, while the built-in AI assistant can generate Python code for comprehensive financial statements and valuation ratios needed for fundamental analysis.