
James Amoo, Community Partner
Apr 17, 2026

Table of contents
To build accurate financial models, spot market trends, and backtest trading strategies, you need reliable market information. In the past, analysts had to download historical stock data through manual processes that wasted valuable time. Today, modern expectations demand automated workflows that keep information up to date automatically.
Moving past basic spreadsheet tools like Excel and Google Sheets and disconnected scripts is essential for modern finance teams. AI-powered spreadsheets now provide a superior and integrated environment that replaces manual downloads entirely.
Why are traditional stock data downloads slowing down analysis?
Relying on manual CSV exports from financial websites is a common starting point for students and novice investors, but it completely lacks scalability. A standard historical stock data download often creates friction because the workflow is inherently disjointed. An analyst might pull information via an external API, clean the dataset in a separate Python script, and finally paste the output into a traditional spreadsheet.
This process increases the risk of version control issues and breaks the chain of data governance. When it is time for a routine stock data historical download to update your models with new market prices, manual errors are almost inevitable. Copying and pasting data across different tools leads to broken formulas and hours spent troubleshooting static files.
Another limitation is the lack of synchronization between datasets and analytical logic. Once a CSV file is downloaded, it becomes a static snapshot in time, disconnected from both the source system and any future updates. As market conditions change, analysts must repeatedly recreate the same workflow, which increases the risk of stale data in the system.
Also, manual download workflows hinder the ability to scale analysis across multiple assets or timeframes. Managing dozens of files for different tickers or periods quickly becomes operationally cumbersome. This limits deeper analysis as more time is spent managing files than actually extracting insights from the data.
Requirements for reliable historical stock price data
Data integrity is the foundation of any financial data analytics. When you initiate a historical stock price data download, you must account for corporate actions like stock splits and dividend payouts. These events fundamentally alter the raw price of an asset and can heavily skew your financial data visualization if left unadjusted.
Using adjusted closing prices is necessary to ensure your historical backtesting and trend analysis remain accurate over time. Analysts must also decide on the right data granularity for their specific project. When you download stocks historical data, you need to choose between end-of-day (EOD) datasets for long-term financial modeling or intraday data for more short-term analysis goals.
Another critical requirement is source reliability and latency transparency. Different data providers may vary in how quickly they update prices, how they handle corrections, and whether they include extended-hours trading data. Analysts must leverage data blending to avoid mixing datasets with different assumptions, ensuring that all inputs align with the intended use case.
Common methods to acquire market data
There are several ways analysts traditionally source their market information, each with distinct trade-offs.
- Manual portal exports: A free historical stock data download from a public financial portal is useful for a quick task. However, this method fails when you try to build an automated financial reporting system.
- Third-party APIs: Another traditional approach is using external APIs or Python libraries to download stock historical data programmatically. While powerful, APIs come with a steep learning curve and demand significant data cleaning overhead before the numbers are usable.
- Direct spreadsheet integration: Modern Excel alternatives offer the feature of pulling data directly into your analysis environment. This bypasses complex setup requirements and eliminates the need to evaluate external data vendors.
How to automate historical stock data with Quadratic
Manual workflows for downloading and maintaining historical stock data introduce unnecessary friction, especially as datasets grow in size and complexity. Quadratic eliminates this overhead by providing a unified environment where data exploration, data transformation, and analysis are automated within a single system. Let’s explore the features of Quadratic in detail:
Direct connections to multiple market data sources
In addition to using the STOCKHISTORY formula, Quadratic allows users to pull historical stock data directly into the spreadsheet using built-in live stock market API integrations. This means users can instantly retrieve time series data without downloading files manually.
This also ensures that your data pipeline remains consistent and repeatable. By removing manual ingestion steps, you eliminate common sources of error and ensure that your analysis always starts from a clean and reliable dataset.
Reusable analytical templates for historical data
Users can build reusable templates for historical stock analysis, including predefined calculations and validation checks. These templates can be applied across multiple securities or timeframes.
This standardization reduces repetitive setup work and ensures consistency in analysis. Over time, teams can develop a library of proven models that accelerate future research.
AI-powered data analysis for historical modeling
Once historical data is available in the grid, Quadratic’s AI agents for data analysis can be used to generate analytical logic for tasks such as calculating moving averages, volatility measures, and performance metrics. This removes the need to manually code complex transformations.
AI-assisted workflows make it easier to experiment with different analytical approaches, from trend analysis to backtesting strategies. Users can iterate quickly and refine their models without rebuilding them from scratch each time.
Let’s see how this works. We’ll be working with a stock history calculator template in Quadratic. Here:
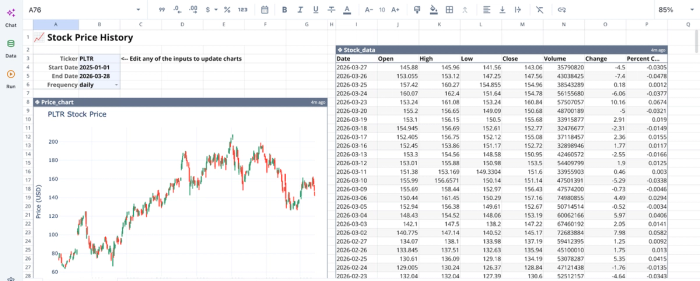
We can immediately begin analysis from this template.
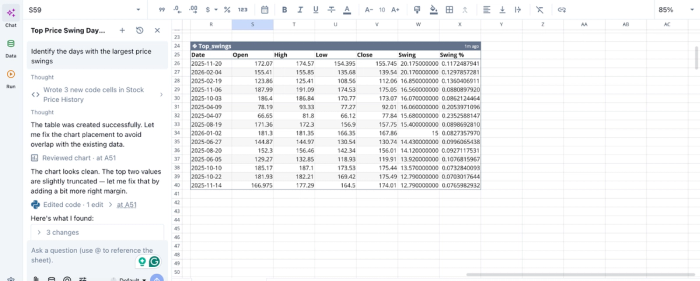
In this image, I ask Quadratic to “Identify the days with the largest price swings”. It generates a table that lists the 15 days with the largest intraday price swings (High − Low), along with the swing percentage relative to the open price. Quadratic allows users to perform advanced stock analysis using text prompts.
AI data visualization
Quadratic enables the creation of dynamic visualizations directly from historical datasets. Users can build different charts that track price movements and technical indicators over time.
These visualizations update automatically as new data is pulled in, providing a real-time view of historical trends. This ensures that your charts always reflect the latest available information without requiring manual updates. Let’s see how we can create visualizations in Quadratic:
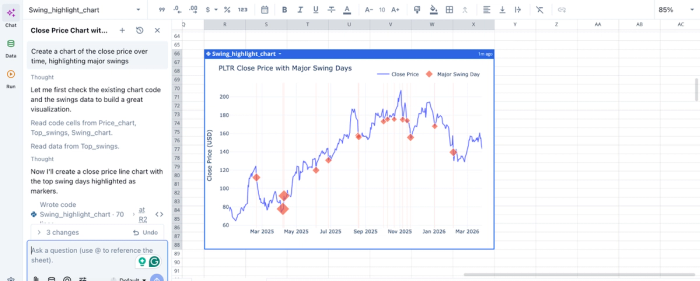
In this image, I ask Quadratic AI to “Create a chart of the close price over time, highlighting major swings”. It generates a visualization that shows Palantir’s closing price with major swing days, based on the stock history data.
Native support for programming languages
Quadratic combines spreadsheet functionality with native Python and SQL support, allowing users to perform advanced business data analysis directly within the platform. This includes cleaning datasets and implementing custom financial models.
This enables both simple and complex workflows to coexist. Users can start with basic spreadsheet logic and progressively incorporate more advanced programming techniques as their analysis evolves.
Conclusion: Stop downloading and start analyzing
The way teams download historical stock data is evolving from manual processes into automated workflows. By eliminating CSV exports and repetitive data cleaning, modern solutions enable analysts to work with continuously updated datasets that are accurate and ready for analysis.
Quadratic brings this transformation into a single environment where you can pull live historical stock data, analyze it, and visualize results without leaving your workspace. By combining live data connections, AI-powered analysis, and collaborative modeling, it removes the complexity of traditional workflows and accelerates the path from raw data to decision-making. Try Quadratic for free.
Frequently asked questions (FAQs)
What are the essential requirements for reliable historical stock price data download?
For a reliable historical stock price data download, analysts must use adjusted closing prices to account for corporate actions like stock splits and dividends. It's also critical to choose the correct data granularity to match specific project analysis goals.
How does Quadratic help modernize the historical stock data download workflow?
Quadratic streamlines the process by pulling stock data directly into the spreadsheet grid, eliminating the need for manual exports or external API configurations. This environment allows users to integrate data cleaning and analysis using Python and AI alongside traditional formulas.
Can you get a free historical stock data download for automated reporting?
While public portals offer a free historical stock data download for one-off tasks, they typically don't support automated reporting systems. Modern workflows focus on integrating data acquisition directly into the analysis environment.