
James Amoo, Community Partner
May 19, 2026

Connecting to a Python stock market API is often treated as the finish line for financial data projects. In reality, successfully fetching the data is just the beginning of the workflow. Raw financial data is notoriously messy and requires data transformation before it can be trusted.
Analysts frequently encounter common pitfalls when pulling raw data or attempting to scrape stock data, including complex JSON structures and unadjusted historical prices. These issues can easily derail your stock market analysis if left unchecked. Raw data is ultimately useless without data cleaning, structuring, and validation to ensure total accuracy.
This guide outlines the step-by-step journey from extracting a raw payload using a stock market data API Python to building a reliable dataset.
Structuring raw API outputs into Python DataFrames
The first major hurdle is converting nested JSON responses into queryable pandas DataFrames. Financial data endpoints and a stock market news API rarely return tabular formats out of the box. You need to extract the exact data payloads from your Python API stock market and map them to a logical grid.
Defining consistent schemas is critical during this phase. You must separate different data types into their own distinct structures. For example, daily price history requires a completely different schema than quarterly fundamentals or financial statements.
Once your data is flattened, setting and aligning datetime indexes is your next priority. A proper datetime index ensures that multiple stock tickers can be joined and compared seamlessly across the same time horizon. Finally, standardizing column names early in the pipeline prevents downstream errors and keeps your data model predictable for future queries.
Quadratic simplifies this entire workflow by allowing you to ingest raw API responses directly and transform them into structured tables without switching between tools. You can clean nested JSON using Python, normalize schemas inside the same workspace, and immediately inspect the resulting DataFrames in a spreadsheet-style interface. This reduces friction between research and data analysis, making it easier to maintain consistent financial datasets.
Essential data cleaning and validation checks
Transforming data into DataFrames is only half the battle. The data must now go through rigorous cleaning and validation to ensure it is accurate and usable.
Handling missing values and incorrect types
Analysts frequently encounter roadblocks like null values, zero amounts where data should exist, and numeric values returned as strings. When working with a stock market API Python, you cannot assume the payload types are strictly enforced by the provider.
You need programmatic techniques to parse strings into floats and cast date strings into proper datetime objects. Missing daily price data is another common issue, especially around market holidays or halted trading days. You can handle this by forward-filling or interpolating missing values. This ensures you maintain a continuous timeline without skewing the underlying financial reporting of the asset.
Routine validation for financial accuracy
Mandatory validation checks must run before any financial data analytics begins. This is especially true if you are using a free stock market API Python, as lower-tier or free data sources often require more rigorous data transformation to catch inconsistencies.
Your workflow should programmatically verify date formats to ensure strict chronological consistency. You must also assert that prices and trading volumes are entirely non-negative. Catching these anomalies early prevents broken models, skewed charts, and stale data later in your workflow.
Structural consistency and schema enforcement
Beyond cleaning individual fields, maintaining structural consistency across datasets is critical for scalable analysis. Financial APIs often evolve, introducing new fields or altering existing response formats, which can silently break downstream pipelines if not properly managed.
To mitigate this, you should enforce strict schema validation rules that define expected columns, data types, and relationships between tables. This ensures that any deviation is immediately flagged. A well-enforced schema acts as a contract between your data source and your analytical models, providing far more reliability than simple stock quotes in Excel.
Normalizing data for financial modeling
Clean data is not necessarily ready for financial modeling. It must first be normalized and mathematically adjusted to reflect true economic reality.
Adjusting for stock splits and corporate actions
Raw historical prices are highly misleading if they are not adjusted for stock splits and dividends. If a company executes a two-for-one stock split, the raw price drops by half, but the actual value of the company remains unchanged.
You must mathematically apply adjustment factors to create a continuous, accurate price history. Many endpoints from a Python stock market data API provide these split and dividend factors specifically for this purpose. Emphasize this step in your pipeline, because failing to account for corporate actions will completely invalidate your return calculations and render your downstream models useless.
Mathematical scaling and returns
Transforming your dataset requires a modern coding spreadsheet to make the data truly model-ready. When analyzing time-series volatility, calculating logarithmic returns is standard practice. This approach provides a more accurate measure of compounding returns over time compared to simple percentage changes.
Additionally, you will need to standardize fundamental metrics to compare equities on an apples-to-apples basis. Applying mathematical scaling techniques, such as calculating Z-scores, allows you to normalize different financial ratios across various companies. This represents the critical transition from raw pulls from your stock market API for Python to highly refined metrics.
Aligning multi-source financial datasets
Once normalization is complete, the next challenge is ensuring that different datasets can be meaningfully combined. Financial models and other financial API use cases often require merging price data, fundamentals, and macroeconomic indicators that originate from separate sources with differing frequencies and reporting standards.
To make this financial API integration reliable, you must align all datasets on a shared time index and resample them into consistent intervals, such as daily or monthly observations. This prevents mismatches where, for example, quarterly earnings data is incorrectly compared against daily price movements. Proper alignment ensures that every variable in your model is synchronized, enabling accurate Python exploratory analysis and reducing structural bias in downstream predictions.
Streamline Python stock market analysis with Quadratic
Quadratic removes the typical friction in Python-based market data workflows by allowing you to pull, transform, and analyze stock data directly inside a spreadsheet environment. Instead of managing separate scripts, you can use AI-generated Python to connect directly to stock market APIs, bringing raw JSON straight into the grid. Let’s explore the features of Quadratic in detail.
Unified Python workflows for market data ingestion
Quadratic simplifies Python-based stock market analysis by removing the traditional separation between data ingestion, scripting, and analysis. Instead of managing external notebooks or backend scripts, you can connect to real-time stock market data, financial databases, and news sources.
Raw JSON responses, time-series price data, and fundamentals are pulled directly into the grid, immediately transforming fragmented API outputs into structured datasets.
Continuous data refresh and automated analysis pipelines
Quadratic extends Python workflows beyond static analysis by supporting scheduled tasks. You can configure scripts to refresh API data, recompute financial models, and update dashboards regularly.
This turns your analysis into a living system where you can create a stock screener with Python, and portfolio metrics and risk models stay continuously up to date without manual intervention.
AI-assisted financial analysis and model building
Quadratic’s AI layer focuses on accelerating the reasoning and modeling side of stock analysis rather than just data processing. You can prompt the AI to generate factor models, propose screening criteria, or design portfolio scoring systems based on financial intuition, such as value or quality metrics.
It can also help translate natural language investment ideas into structured analytical logic. This reduces the cognitive and implementation overhead of testing new investment hypotheses while keeping all outputs transparent and editable. Let’s see how this works using Quadratic’s built-in stock market analysis template:
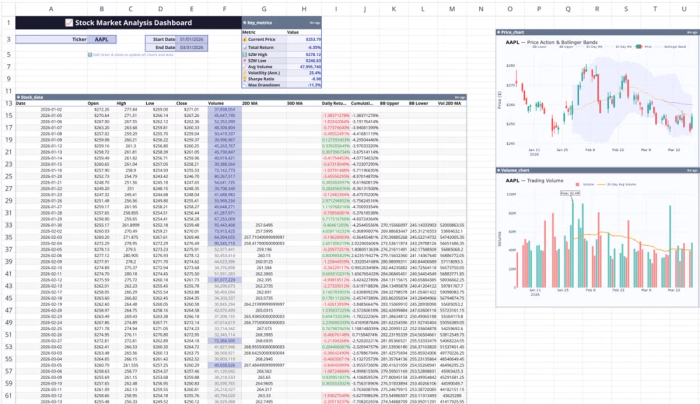
This template includes ready-made features for real-time stock data visualization, technical indicator calculations (RSI analysis), price trend analysis, and volume analysis to help you balance fundamental analysis vs technical analysis. You can also perform advanced analysis on this data using simple text prompts:
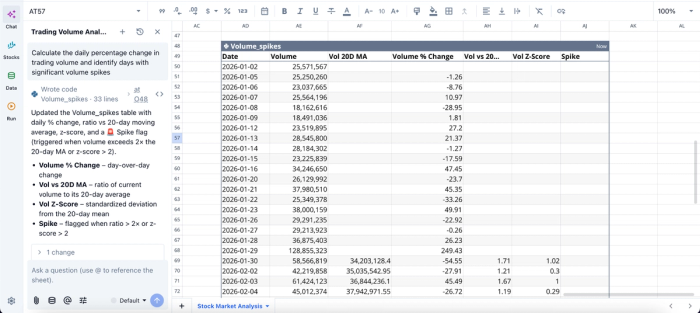
In this image, I ask Quadratic AI to “Calculate the daily percentage change in trading volume and identify days with significant volume spikes”. It instantly generates a table that gives a breakdown of volume spikes across the 30-day window, showing days where a spike occurs.
Native visualization of stock signals and portfolio behavior
Quadratic enables financial data visualization of Python outputs without switching to external BI tools. You can chart price trends, rolling returns, and drawdowns directly alongside your computed datasets.
This allows you to quickly identify relationships without breaking analytical flow. Visualization in Quadratic can also be done using text prompts:
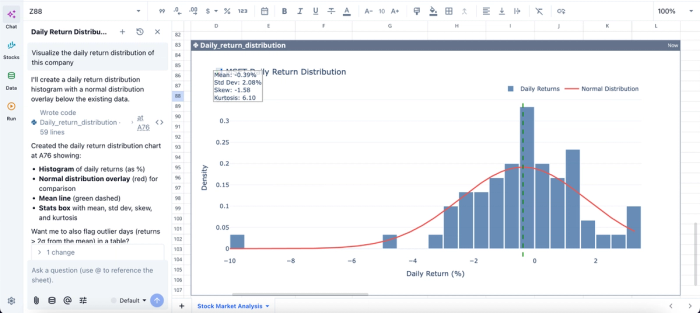
In this image, I ask Quadratic AI to “Visualize the daily return distribution of this company”. It creates a histogram of the daily returns alongside the normal distribution overlay. This helps non-technical stakeholders and beginners easily understand the insights generated from raw data.
Real-time collaboration for investment research teams
Stock analysis is rarely a solo process, and Quadratic supports this by enabling real-time collaboration on Python-powered financial models. Multiple analysts can simultaneously edit logic or annotate insights within the same workspace. Changes propagate instantly, ensuring everyone works from a single source of truth.
This eliminates version conflicts common in a traditional stock portfolio tracking spreadsheet and makes it easier to coordinate research across strategies or asset classes.
Conclusion
Traditional data cleaning often leaves analysts working in the dark. Writing scripts to blindly verify complex financial tables makes it difficult to spot subtle anomalies. Working inside a visual spreadsheet interface offers a much more reliable and transparent approach.
Quadratic allows users to pull data from a stock market Python API directly into the grid using native Python. This setup enables immediate visual inspection of your DataFrames and charts, ensuring you can spot data errors the moment they occur. Instead of manually writing tedious validation scripts. Users can also run Python stock market API workflows inside the spreadsheet environment and turn data into charts and models immediately. Try Quadratic for free.
Frequently asked questions (FAQs)
Why is raw data from a Python stock market API not immediately ready for analysis?
Raw data from a Python stock market API often contains complex JSON structures, missing trading days, and unadjusted historical prices. These inconsistencies require significant cleaning, structuring, and validation before the data can be reliably used for financial analysis.
How does Quadratic improve the workflow for a Python stock market API?
Quadratic allows users to pull data from any Python stock market API directly into a visual spreadsheet interface, enabling immediate inspection and error spotting. Its built-in AI capabilities automate the generation of Python code for cleaning rules, validation, and normalization steps, streamlining the entire data preparation process.
Why is normalizing financial data important after cleaning?
Even clean data needs normalization to reflect the true economic reality for financial modeling. This involves mathematically adjusting for stock splits and dividends, and applying scaling techniques like logarithmic returns or Z-scores to compare equities accurately. This step is essential before any meaningful analysis with your stock market API for Python data.