
James Amoo, Community Partner
May 19, 2026

Table of contents
- The limitations of a basic stock spreadsheet tracker
- Core quantitative elements to include in your tracker
- Moving beyond the basics: integrating market context
- Establishing a repeatable portfolio review cadence
- How Quadratic elevates your stock tracking workflow
- Conclusion
- Frequently asked questions (FAQs)
Investors often begin their journey seeking a reliable way to monitor their investments. A basic stock tracking spreadsheet is usually the first step, providing a simple list of tickers and stock quotes in Excel. But tracking daily price movements isn't enough to improve your investment portfolio spreadsheet.
To make informed decisions, you need a dynamic tool that combines raw performance data with the context behind your choices. This guide will show you how to move beyond a static list of holdings to build a comprehensive investment dashboard for portfolio tracking. By integrating qualitative notes alongside quantitative metrics, you can transform a standard spreadsheet into a powerful analytical engine.
The limitations of a basic stock spreadsheet tracker
Most DIY investors begin by setting up a simple stock tracking spreadsheet. Often built as a basic Google spreadsheet stock tracker or a quick file for stock data in Excel, these setups rely on standard functions to pull in ticker symbols, current prices, and calculate straightforward profit and loss.
While a stock tracker spreadsheet is helpful for a glance at your balance, stopping at this basic level carries risks. A simple ledger lacks the "why" behind your trades. It tells you that a stock went down 5%, but it doesn't remind you of your original investment thesis or provide the broader market context influencing that price drop. To support actual decision-making and prevent emotional reactions to market volatility, investors need a more robust software for stock market analysis that captures both performance and rationale.
Quadratic addresses these limitations by transforming static portfolio trackers into dynamic research environments. Instead of simply recording positions, you can integrate live market data, create a stock screener with Python, and build interactive dashboards that combine performance metrics with contextual insights. This creates a more complete decision-making system where both the numbers and the reasoning behind them remain visible and actionable.
Core quantitative elements to include in your tracker
Before adding advanced analytics, every spreadsheet for stock tracking needs a strong data analytics strategy of quantitative metrics. These core data points satisfy the requirements of basic portfolio monitoring and establish the baseline for deeper analysis.
A reliable stock portfolio tracking spreadsheet should include columns for asset class categorization, initial purchase price, and the number of shares held. From there, you can calculate realized and unrealized gains to see exactly where your capital stands. Once these foundational performance metrics are calculated correctly, your spreadsheet is ready for tracking stocks and more advanced layers of data.
Beyond simple return calculations, it is valuable to incorporate risk-oriented metrics into your tracker. Monitoring portfolio allocation percentages, volatility, drawdowns, and sector concentration helps investors understand not just how much they are earning, but how much risk they are taking to achieve those returns. Adding these measurements transforms a basic tracking sheet into a more complete portfolio management system capable of supporting long-term investment decisions.
Moving beyond the basics: integrating market context
True spreadsheet stock tracking goes beyond isolated price updates. To elevate your analysis, you need to bring a broader stock research context directly into your workflow.
Start by pulling in fundamental financial metrics alongside your price data. Adding price-to-earnings ratios or custom valuation models helps you evaluate whether a stock is currently overvalued or undervalued. It is equally valuable to view macroeconomic data next to your individual holdings to understand how broader trends might impact your specific sectors.
Integrating a stock market news API directly into your spreadsheet workflow can also help contextualize sudden price movements. Combining real-time prices and news creates a complete picture of an asset's true value, ensuring you never evaluate a stock in a vacuum.
Another important step is incorporating comparative benchmarking into your tracker. Measuring your portfolio or individual holdings against market indices, sector ETFs, or peer companies provides an essential perspective on performance. A stock gaining 8% may appear strong in isolation, but if the broader sector gained 15% during the same period, that relative underperformance could signal deeper weaknesses. Benchmarking helps investors distinguish between market-driven gains and true alpha generation, leading to more informed portfolio decisions.
Establishing a repeatable portfolio review cadence
A highly functional spreadsheet should dictate a systematic review process, rather than just acting as a static ledger. Whether you use a modern web-based tool or a traditional stock tracking Excel spreadsheet, establishing a repeatable portfolio review cadence is essential.
Structure your reviews by setting specific intervals for fundamental analysis and technical analysis. For example, you might schedule a brief weekly check-in to review financial news and monitor short-term price volatility. Then, plan a monthly or quarterly deep dive to assess fundamental shifts and dividend payouts. During these structured reviews, compare your current quantitative data against the qualitative notes you previously logged.
Over time, this consistent review cadence also improves the quality of your decision-making framework. By documenting why positions were entered and which signals proved reliable, you create a historical feedback loop for refining your investment strategy. This process transforms your spreadsheet from a passive tracking tool into an evolving research system that helps identify recurring strengths and behavioral biases in your portfolio management approach.
How Quadratic elevates your stock tracking workflow
When you are ready to build a truly dynamic investment tool, Quadratic provides the ideal environment. By combining the familiarity of a spreadsheet with native Python, SQL, and built-in AI, it allows you to pull historical prices and financial news for financial data analysis directly into the grid. Let’s explore the features of Quadratic in detail.
Pull live prices, fundamentals, and financial news into one grid
Effective portfolio tracking requires more than just ticker symbols and daily price changes. Quadratic allows you to connect directly to real-time stock market data so your spreadsheet automatically retrieves historical prices, valuation metrics, and market news.
This approach removes the need for repetitive CSV imports or disconnected browser tabs. You can monitor revenue growth and macroeconomic indicators alongside your portfolio positions in real time. By centralizing all relevant information, your spreadsheet evolves into a true investment portfolio dashboard.
Build portfolio models with Python directly inside the spreadsheet
As portfolios grow more sophisticated, standard spreadsheet formulas and traditional Python in Excel setups often become limiting. Quadratic supports native Python and SQL directly within the grid, enabling you to create advanced analytical workflows without leaving the spreadsheet environment.
You can calculate volatility metrics, portfolio correlations, moving averages, factor exposure, or apply machine learning for stock selection using Python libraries alongside traditional formulas. This allows investors to move beyond a basic Python stock tracker and into quantitative portfolio analysis without maintaining separate coding environments.
For example, you can build a portfolio stress-testing model that evaluates how your holdings may respond to interest rate shifts or sector-specific downturns, all within the same file that stores your positions and watchlists.
Automate updates and recurring portfolio workflows
One of the biggest weaknesses of traditional tracking spreadsheets is the need for constant manual maintenance. Quadratic supports scheduled updates and automated workflows that keep your portfolio models continuously current.
Data refreshes, calculations, and dashboards can run automatically in the background, ensuring that your analysis reflects the latest market conditions without requiring manual intervention. This spreadsheet automation makes your workflow significantly more scalable and reliable over time.
Use AI to accelerate stock research and portfolio reviews
Researching multiple holdings manually can quickly become overwhelming, especially when market conditions shift rapidly. Quadratic’s AI capabilities help streamline this process by assisting with stock research, summarization, and Python exploratory analysis.
You can ask AI to compare valuation multiples across your watchlist, identify unusual performance trends, summarize earnings developments, or highlight companies with deteriorating margins. Rather than spending hours manually filtering datasets, you can rapidly surface actionable insights while still retaining full visibility into the underlying data.
Let’s see how this works using Quadratic’s stock research template:
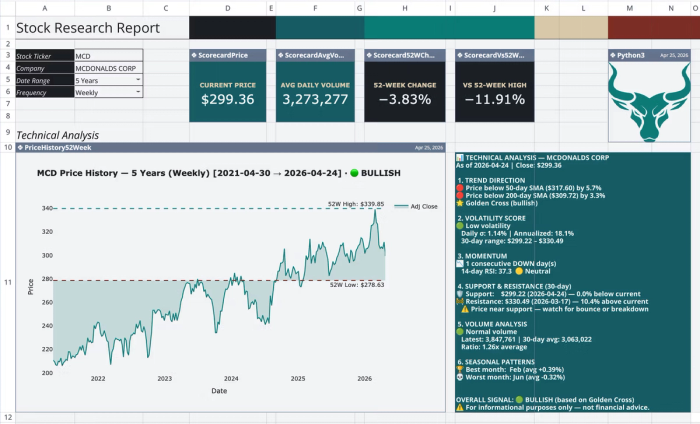
This template provides a single-ticker financial research dashboard for comprehensive financial reporting, organized across four sheets. It automates the retrieval of historical price data and the calculation of technical indicators directly within the spreadsheet.
If you need to get insights that aren’t provided in this template, you just have to ask using simple text prompts:
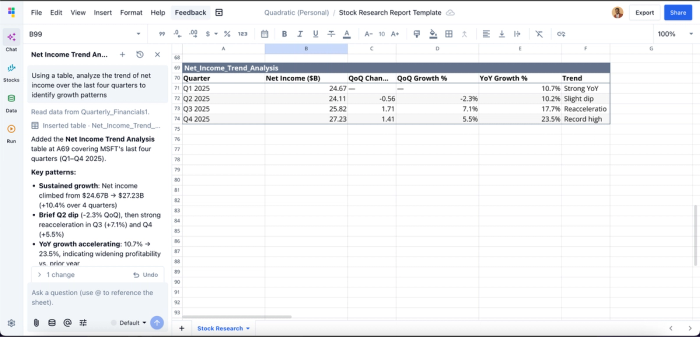
Here, I prompt Quadratic to “Using a table, analyze the trend of net income over the last four quarters to identify growth patterns”. It instantly generates a table that gives insights into the net income trend analysis, which was not previously included in the template.
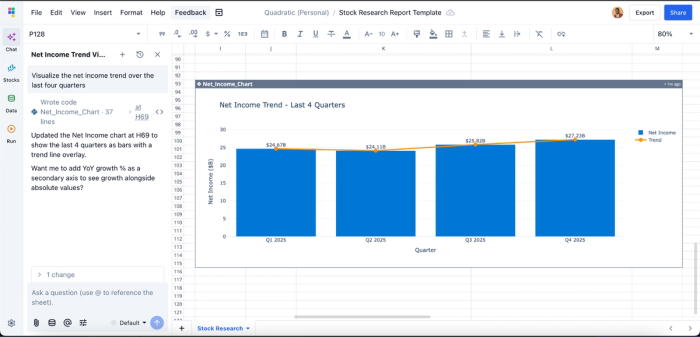
Visualize portfolio performance and market behavior dynamically
A modern tracking workflow should make trends immediately understandable. Quadratic enables you to build live dashboards and financial data visualizations directly on top of your investment data.
You can chart allocation breakdowns, monitor sector concentration, or visualize portfolio drawdowns over time. Since these visualizations are connected to live data pipelines, charts update automatically as market conditions evolve.
This makes it easier to identify risk exposure and spot changes in portfolio behavior before they become major issues. Visualizations in Quadratic can also be done using text prompts:
Collaborate on portfolio analysis in real time
Investment research increasingly involves collaboration between analysts, advisors, and team members. Quadratic’s browser-based multiplayer environment enables multiple users to work on the same portfolio model simultaneously.
Teams can review assumptions and analyze holdings together without dealing with conflicting spreadsheet versions. This collaborative analytics platform improves transparency while reducing operational friction in shared investment workflows.
Conclusion
A modern stock tracking spreadsheet should do far more than display prices and profit-and-loss figures. The most effective workflows combine live market data, fundamentals, financial news, qualitative investment notes, and portfolio analytics into a single evolving research system.
Quadratic takes this concept even further by unifying live data connections, Python-based analytics, AI-assisted research, dynamic visualizations, and collaborative workflows inside one spreadsheet environment. It allows you to create a smarter stock tracking spreadsheet that transforms portfolio management from a manual chore into a streamlined analytical process. Try Quadratic for free.
Frequently asked questions (FAQs)
What are the limitations of a basic free stock tracking spreadsheet?
A basic stock tracking spreadsheet typically provides only current prices and straightforward profit/loss calculations. It lacks the crucial context of your original investment thesis or broader market factors, making it difficult to understand the "why" behind price movements or make informed decisions.
How can I upgrade a simple stock tracking spreadsheet for better insights?
To move beyond a simple stock tracking spreadsheet, integrate comprehensive quantitative metrics like purchase price and percentage returns, alongside market context such as fundamental ratios and relevant news. Additionally, logging qualitative data like your investment thesis and decision rationale transforms it into a powerful analytical engine.
How does Quadratic help transform a stock tracking spreadsheet into an analytical tool?
Quadratic elevates a traditional stock tracking spreadsheet by integrating native Python, SQL, and AI, allowing direct pulls of live historical prices and financial news into the grid. This enables automated data analysis and collaborative notes within a single workspace, providing a complete and contextual view of your portfolio.