James Amoo, Community Partner
May 7, 2026

For analysts and developers, getting access to a financial news API is the easy part. The real challenge lies in transforming that raw firehose of unstructured text into a decision-ready format. A JSON payload full of metadata and HTML tags is not immediately useful for an analyst tracking stock market catalysts or building financial models.
This article outlines a step-by-step methodology for fetching, filtering, mapping, and classifying news data to build actionable research dashboards. Rather than comparing specific API vendors, this guide focuses entirely on the technical workflow and data structuring process. Whether you are building an automated report or a live tracker, mastering the process of handling financial data API news is critical for generating real insights.
Why raw news feeds require structured workflows
Raw API responses are notoriously messy. When you query financial APIs news endpoints, you typically receive JSON payloads packed with irrelevant metadata, raw text, and general market noise. To turn this into structured financial intelligence, the data must be systematically cleaned and organized through automated data processing.
The true power of news data emerges when you combine these qualitative stories with quantitative datasets, such as historical market data, technical indicators, or fundamental metrics from a financial statements API. Establishing a structured workflow for financial data APIs news delivers immediate business value, reinforcing the importance of building a solid data infrastructure and analytics strategy. It reduces the latency in your decision-making process by filtering out the noise and ensuring consistent data quality for research and data analysis.
Quadratic streamlines this process by allowing you to ingest raw API responses, transform JSON into structured tables, and analyze both qualitative and quantitative data within a single environment.
The challenge of building live news dashboards
The standard industry approach for visualizing structured data involves building standalone web applications using frameworks like Streamlit, Flask, or Plotly. While powerful, this traditional route introduces significant friction. It requires deployment overhead and constant maintenance.
More importantly, it creates a disconnect between the developers building the app and the finance teams consuming the data. Even the best financial news API requires a robust frontend to be useful. However, forcing analysts to leave their native spreadsheet environment to use a custom web app creates data silos and slows down market research.
Another challenge is iteration speed. Financial analysis is inherently exploratory, requiring analysts to tweak filters and test new hypotheses quickly. Traditional dashboards are not built for this level of flexibility. This slows down the feedback loop and limits how effectively teams can respond to fast-moving market developments.
Additionally, maintaining consistency across data, logic, and visualization layers becomes increasingly difficult over time. As dashboards evolve, discrepancies can emerge between backend data pipelines and frontend displays. Without a unified environment where data ingestion, transformation, and visualization are tightly integrated, teams risk relying on misaligned or stale data, undermining the reliability of their decision-making processes.
Designing a pipeline for your financial news API Python workflow
Transforming a raw feed into a usable application requires a well-designed end-to-end pipeline. Whether your team relies on an enterprise solution or a free financial news API, the underlying data processing logic remains the same.
Building a robust financial news API Python workflow ensures that data is consistently retrieved and structured before any visualization takes place. An effective API for financial news is only as good as the programmatic pipeline that processes it.
Step 1: Programmatic retrieval and authentication
The first stage of the pipeline is securely authenticating with your chosen endpoint using Python. This involves managing API keys securely and establishing a reliable connection. Once connected, your script must handle pagination and respect rate limits to ensure an uninterrupted data stream.
Properly parsing the initial JSON response is essential. To keep the incoming data highly relevant, configure your query parameters effectively. Set up time-based filters to pull only recent articles, or use ticker-based parameters to isolate news about specific assets. Even if you are experimenting with a financial news API free tier, implementing these retrieval best practices prevents your pipeline from breaking under load.
Step 2: Filtering and entity mapping
Raw headlines and article bodies contain valuable entities, but they need to be extracted systematically. Your pipeline should focus on extracting valuable entities such as specific company tickers, executive names, and macroeconomic terms.
Since news feeds are often cluttered, it is vital to filter out duplicate stories, syndicated press releases, and articles from irrelevant sectors. This filtering step drastically improves overall data quality. Once the core entities are extracted, map them to standard identifiers, such as official stock tickers. This mapping process is what allows you to seamlessly join qualitative news stories with quantitative market data later in your workflow.
Step 3: Classification and structuring
With the data filtered and mapped, the next step is categorization. Grouping articles into actionable buckets helps analysts quickly digest the news landscape through effective news categorization.
Once categorization and data transformation are done, format this cleaned, mapped, and classified data into a structured tabular format. Organizing the text into rows and columns makes it immediately suitable for dashboard integration. While advanced machine learning sentiment analysis is a popular topic, simple classification and summarization often provide more transparent value for finance teams looking for clear catalysts.
Building a structured research workflow with Quadratic
Quadratic provides an ideal environment for this workflow, combining the transparency of a modern spreadsheet with the power of native Python and SQL. Instead of battling the overhead of traditional web frameworks, teams can build a fully automated dashboard directly in a familiar grid. Let’s explore the features of Quadratic in detail.
Pull and structure financial news data directly in your model
A usable research workflow starts with transforming unstructured news into structured data. Quadratic allows you to retrieve financial news directly from APIs and real-time stock market data.
Once ingested, the data can be flattened and normalized into a clean tabular format with fields like ticker, headline, timestamp, source, and sentiment indicators. This step is critical because it converts fragmented news feeds into a consistent dataset that can be queried and analyzed alongside traditional financial metrics.
Automate continuous data ingestion and analysis
A structured workflow must operate continuously to remain relevant. Quadratic allows you to schedule data processing, ensuring that new articles are ingested and analyzed without manual intervention. Your models, signals, and dashboards update in the background as fresh information becomes available.
This spreadsheet automation transforms your workflow from a reactive process into a proactive system. Instead of manually checking for updates, you maintain a continuously running research pipeline that keeps your insights current and actionable.
Build event-driven signals and custom research logic with Python
To move from observation to action, you need to formalize how news impacts your investment decisions. Quadratic allows you to use native Python and SQL for data analysis to create event-driven signals directly within your dataset. You can define rules that quantify sentiment, or track how often certain companies appear in high-impact news cycles.
These signals can then be integrated into broader models, such as ranking systems or alert frameworks. This logic is embedded in the same environment as your data, so you can continuously refine your approach and adapt your models without managing separate codebases.
Use AI to summarize, classify, and prioritize information
Processing large volumes of financial news manually is inefficient. Quadratic’s AI capabilities allow you to operate directly on text data within the grid. You can prompt the system to summarize lengthy articles into concise insights, extract key themes, or classify news items by category.
This makes it easier to prioritize relevant financial information. Instead of scanning hundreds of headlines, you can filter by event type or significance and focus only on the signals that matter to your strategy. Over time, this creates a scalable system for turning raw news into actionable intelligence.
Let’s see how this works using Quadratic’s built-in stock research template:
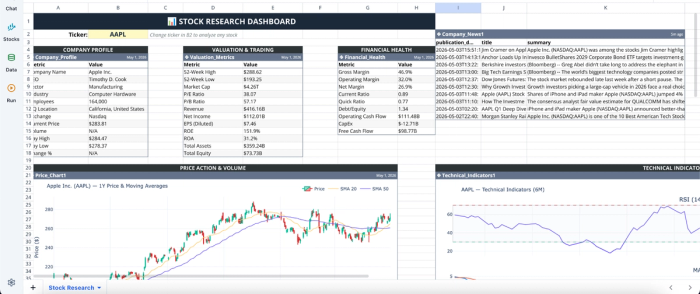
This template provides a single-ticker financial research dashboard for comprehensive financial reporting, organized across four sheets. It automates the retrieval of historical price data and the calculation of technical indicators directly within the spreadsheet. It also includes the ten recent financial news items for that particular company. Users can also ask questions based on the financial news:
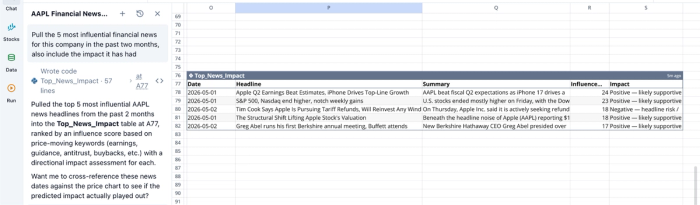
In this image, I ask Quadratic AI to “Pull the 5 most influential financial news for this company in the past two months, also include the impact it has had.” Right from the spreadsheet environment where we have our stock research data, it creates a table that shows the 5 most influential financial news, alongside the summary, influence score, and impact.
Visualize news impact with integrated analytical dashboards
Understanding the relationship between news and market behavior requires clear financial data visualization. Quadratic enables you to build dynamic dashboards that track how news events correlate with price changes, volatility spikes, or volume surges. You can create timelines that overlay key headlines with market movements or aggregate sentiment trends across sectors.
These visualizations update automatically as new data flows in, allowing you to monitor patterns in real time. This makes it easier to identify recurring triggers and communicate insights effectively without exporting data to external tools. Visualizations can also be done by using text prompts:
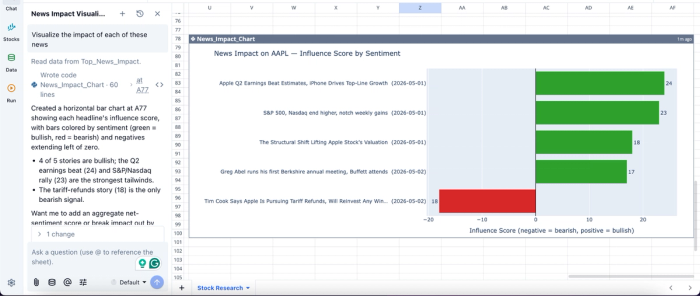
In this image, I ask Quadratic to “Visualize the impact of each of these news.” It instantly generates a chart that gives visual insights into the influence score by sentiment. This immediately signifies how much each item has impacted market conditions.
Collaborate on research and maintain shared context
Financial research often involves multiple contributors interpreting the same information. Quadratic’s real-time collaboration features allow teams to work together within a shared workspace. Analysts can review structured news data and validate insights collaboratively without version conflicts.
This transparency reduces misalignment and ensures that research outputs are consistent and easy to audit.
Conclusion
Transforming unstructured text into actionable insights requires a disciplined approach to programmatic retrieval, entity mapping, and classification. The true value of news data is unlocked only when it is properly structured and combined with other quantitative financial metrics in an accessible format.
Quadratic streamlines this process by bringing these workflows into a unified environment, allowing finance teams to eliminate silos and accelerate their research. Try Quadratic for free to turn financial news API data into a structured research dashboard.
Frequently asked questions (FAQs)
What is the primary challenge when working with a financial news API?
The main challenge isn't just gaining access to a financial news API, but transforming the raw, unstructured text data it provides into a structured and decision-ready format. This process requires systematic cleaning, organization, and classification to extract actionable insights for financial analysis.
What are the key steps for structuring raw financial news API data?
Structuring raw financial data APIs news involves a pipeline that includes programmatic retrieval and authentication, followed by rigorous filtering and entity mapping. The final steps are classification of the news items and formatting the data into a structured tabular layout, making it suitable for dashboards and further analysis.
How does Quadratic help analysts process financial news API data?
Quadratic provides a unified environment where analysts can programmatically retrieve, filter, and structure financial news API data directly within a spreadsheet-like grid using Python. It then allows seamless integration with other financial datasets and offers AI tools for efficient summarization and classification of articles, all in one collaborative workspace.