James Amoo, Community Partner
Apr 17, 2026

Investors face a dual challenge when navigating the markets: organizing deep research while keeping emotions and bad data in check. Many investors make common mistakes when tracking stock that lead to poor decisions, such as reacting to daily noise or failing to eliminate stale data. However, a well-structured stock tracker can help mitigate these risks and foster the necessary discipline required for financial data analytics.
This article covers how to identify frequent tracking errors, structure your data for reliability, and set up systematic review processes to ensure your investments align with your long-term goals.
Common pitfalls in tracking stocks (and how to avoid them)
A tracking system is only as reliable as the discipline of the investor using it. When your data is disorganized or outdated, poor tracking habits directly lead to emotional trading and mismanaged risk. Even the most sophisticated stock market tracker becomes a liability if the foundational data is flawed or scattered. To build a resilient system, you first need to recognize the specific structural and behavioral mistakes investors commonly make when organizing their portfolios.
Falling for short-term noise over long-term trends
One of the most common behavioral biases is obsessing over daily price fluctuations rather than tracking long-term fundamental progress. Watching a ticker jump or dive by the hour triggers emotional responses. This often leads to panic selling or fear-of-missing-out buying, causing investors to abandon well-researched investment theses.
To prevent this, structure your forecasting tools to emphasize long-term performance metrics. Incorporate moving averages, historical context, and quarterly fundamental data so you can evaluate a company's actual progress rather than its daily volatility.
The danger of portfolio sprawl
Portfolio sprawl occurs when your assets, watchlists, and research notes are chaotically spread across multiple isolated brokerage accounts and disconnected financial apps. When your information is fragmented, it becomes nearly impossible to get an accurate picture of your total risk exposure or sector weighting. You might be overexposed to a specific industry without even realizing it.
The solution is to leverage data blending to consolidate all asset tracking and research notes into a single stock portfolio tracker. Bringing everything into one workspace ensures you have a clear view of your financial reporting.
Relying on manual data entry and stale information
Manually typing in ticker prices or copying and pasting fundamental data inevitably leads to human error. A single misplaced decimal point can completely skew your analysis. Furthermore, manual updates are tedious, meaning they are often neglected.
This results in stale data, forcing you to conduct critical research and data analysis based on outdated market conditions. To enforce error-free reviews, your system must rely on systematic data exploration rather than manual keystrokes.
Ignoring risk metrics and position sizing
Many investors focus heavily on returns while overlooking how much risk they are taking to achieve those returns. Without tracking key metrics like position size and portfolio volatility, it becomes easy to take on outsized risk in a single trade or cluster of trades. This often only becomes visible after losses occur, at which point corrective action is reactive rather than planned.
To avoid this, your predictive analytics system should clearly display risk exposure alongside performance. Include fields for position sizing, percentage allocation, and maximum acceptable loss per trade. This allows you to build a solid data infrastructure and analytics strategy that supports consistent decision-making and prevents any single position from disproportionately impacting your portfolio.
Lack of defined review and rebalancing routines
A common structural mistake is treating portfolio tracking as a passive activity rather than an active process. Many investors record trades and monitor performance in an investment portfolio spreadsheet, but fail to establish a consistent review cycle. Without regular evaluation, underperforming positions linger, and portfolio allocations drift away from their intended strategy.
To address this, implement a fixed review schedule where you assess performance and revisit your original investment theses. This ensures your portfolio remains aligned with your goals and current market conditions. Over time, it also builds a feedback loop that helps you identify what is working and where adjustments are needed.
How to build a resilient stock tracker spreadsheet
Moving past these common behavioral and structural traps requires an actionable solution. A modern stock tracker spreadsheet or coding spreadsheet provides the exact flexibility needed to organize deep research while enforcing strict investment discipline. Unlike rigid apps or searching for a MarketXLS alternative, spreadsheet stock tracking allows you to customize your views and build a reliable tracking system tailored to your specific strategy. Here are the core components required to build one effectively.
Define strict watchlist criteria
The first step in building your tracker is defining investment watchlist criteria and establishing clear rules for adding stocks to your watchlist, similar to a stock screener for swing trading. Whether you prioritize fundamental strength or specific technical setups, you need defined parameters.
Strict criteria act as a necessary filter against emotional decision-making and market hype. To keep yourself accountable, track the rationale or specific market catalyst for each ticker directly next to its price data. This provides immediate context when reviewing why a stock caught your attention in the first place.
Categorize assets for strategic clarity
Once your assets are in the tracker, group them logically. Categorize your investments by sector, strategy type, or current market conditions.
Proper spreadsheet analysis helps you quickly assess your portfolio's balance and identify dangerous overexposure to a single industry. Use clear tagging systems within your tracker to sort, filter, and review your investments easily. This makes it simple to see if your actual holdings align with your intended strategy.
Automate data ingestion
Pulling live market feeds directly into your workspace eliminates the risks associated with manual updates. When prices and historical data flow in automatically, your analysis remains grounded in reality.
Beyond just price action, integrating financial fundamentals automatically ensures you always have the latest earnings and revenue figures at your fingertips. This kind of spreadsheet automation handles the tedious data transformation, freeing up your valuable time for actual strategic business data analysis and decision-making.
Track performance with standardized metrics
A resilient tracker should go beyond listing holdings and prices; it must measure performance in a consistent and meaningful way. Without standardized metrics, it becomes difficult to compare positions or evaluate whether your strategy is actually working.
To implement this effectively, define a fixed set of performance indicators and apply them across all tracked assets. This ensures every position is evaluated using the same framework. Over time, these metrics help you identify patterns in your winning and losing trades, allowing you to refine your strategy based on real data rather than assumptions.
Build alert systems and decision triggers
A strong tracking system should not only store information but also prompt action when necessary. Without clear triggers, it is easy to overlook important changes such as price breakouts or risk thresholds being breached. This can lead to missed opportunities or delayed responses to emerging risks.
To address this, incorporate simple alert mechanisms or conditional formatting within your spreadsheet. For example, you can highlight stocks that hit predefined entry or exit levels, or flag positions that exceed your risk limits. These visual or automated cues act as a decision-support system.
How Quadratic streamlines tracking stock
Effective stock tracking requires a disciplined system that integrates data and presents insights in a way that supports rational decision-making. Quadratic transforms traditional tracking methods into a continuously updated workflow where every metric and signal is transparent and aligned with your investment framework. Let’s explore the features of Quadratic.
Direct connections to multiple financial data sources
Quadratic enables seamless integration with live stock market data, databases, and external APIs, allowing you to track stocks using continuously updated inputs without needing to scrape stock data. This removes the need for manual data entry or periodic CSV uploads.
With all relevant data flowing into a single workspace, you can track price movements, fundamentals, and portfolio positions together. This helps to create a cohesive view of each asset.
AI-powered data analysis for disciplined tracking
Quadratic’s built-in AI agents for data analysis help you gain insights about a stock using simple text prompts. It also allows you to define structured tracking rules, such as monitoring valuation thresholds or flagging deviations from expected performance. These rules can be applied consistently across your entire watchlist.
This ensures that your tracking process remains objective. Instead of reacting to noise, you rely on predefined criteria that highlight meaningful changes in your investments. In Quadratic, you can either build your own stock tracking spreadsheet or leverage the built-in stock market analysis template.
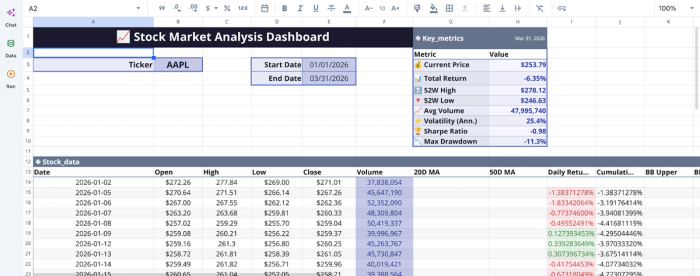
Let’s see how we can conduct data analysis using this template:
This template comes with ready-made features for trend analysis, technical indicator calculations, volume analysis, and real-time stock data visualization. Users can either add more metrics to this template or query the existing data to gain more insights. Here:

In this image, I ask Quadratic AI to “Analyze the daily percentage change in stock price to identify trends and outliers.” It instantly creates a separate table that gives insights into additional metrics like percentage changes, outlier analysis, and trend analysis.
AI data visualization for clarity and context
Quadratic provides integrated financial data visualization capabilities that help you convert raw tracking data into actionable insights. You can build dashboards that display price trends, performance comparisons, and key indicators in real time.
These visualizations help you quickly assess whether a stock is behaving according to your expectations. By linking charts directly to your underlying data, you maintain consistency between what you see and what drives your decisions. Visualization in Quadratic is also done by using simple text prompts. Here:
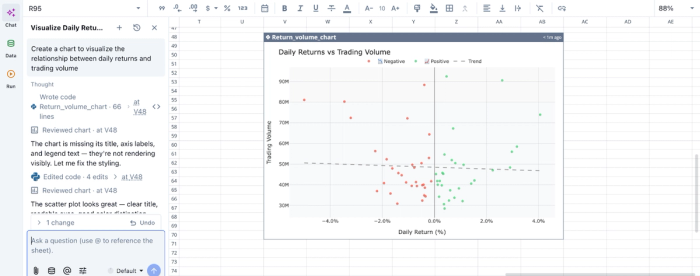
In this image, I ask Quadratic AI to “Create a chart to visualize the relationship between daily returns and trading volume.” In seconds, it generates a scatter plot that visualizes the daily returns vs trading volume to aid easy data interpretation.
Native support for programming languages
With built-in support for Python, SQL, and spreadsheet formulas, Quadratic allows you to implement sophisticated tracking logic without being constrained by the limitations of traditional spreadsheets like Excel and Google Sheets. You can calculate custom metrics, automate evaluations, and structure complex workflows.
This flexibility enables you to tailor your tracking system to your specific investment strategy. Whether you focus on fundamental analysis vs technical analysis, or a hybrid approach, your logic remains centralized and scalable.
Historical tracking and performance benchmarking
Quadratic allows you to maintain a continuous record of stock performance over time without needing to manually download historical stock data, enabling detailed benchmarking against indices or custom targets. This provides valuable context for evaluating long-term trends.
By comparing actual performance against expectations, you can refine your tracking criteria and improve your investment process. This feedback loop is essential for building consistency and discipline.
Collaboration and shared tracking systems
Quadratic supports collaborative workflows, allowing multiple users to contribute to and review the same tracking system. This is particularly useful for investment teams or individuals seeking external validation of their analysis.
Shared access ensures that everyone operates from the same data and logic. This reduces discrepancies and fosters more collective decision-making.
Conclusion
Tracking stock successfully requires combining sound behavioral habits with a structurally sound tracking system. By avoiding manual entry errors and eliminating fragmented data, you lay the groundwork for making long-term investment choices.
When your data is accurate, organized, and automatically refreshed, you can trade with discipline and clarity. Quadratic allows you to seamlessly track your stock and perform analysis with live market data. Try Quadratic for free.
Frequently asked questions (FAQs)
How can a resilient stock tracker spreadsheet improve investment discipline?
A resilient stock tracker spreadsheet helps by consolidating all your investment data into one place. It allows you to structure data to emphasize long-term trends over short-term noise and automate updates, which fosters disciplined decision-making rather than emotional reactions.
How does Quadratic help in creating a reliable stock market tracker?
Quadratic streamlines your stock market tracker by automating data ingestion, using its built-in support for coding to pull real-time price data directly into the grid. It also leverages AI-generated Python to integrate comprehensive financial fundamentals and allows scheduling updates.
Why is automating data ingestion important for spreadsheet stock tracking?
Automating data ingestion is crucial for spreadsheet stock tracking because it eliminates human error and ensures your analysis is based on the most current market information. This prevents making critical investment decisions with outdated data.