
James Amoo, Community Partner
May 7, 2026

Table of contents
- Why most Python stock screeners break down
- Step 1: Define your universe and data schema
- Step 2: Compute factors and handle messy data
- Step 3: Scoring, ranking, and filtering
- Step 4: QA validation and backtest checks
- Step 5: Packaging outputs as repeatable templates
- Building an auditable screener workflow in Quadratic
- Conclusion
- Frequently asked questions (FAQs)
If you want to create a stock screener with Python, the internet is full of quick tutorials showing how to pull basic pricing data and apply a simple filter. But for serious analysts, customization is only part of the equation. The real differentiators are reliability and reuse. A true screening workflow is an auditable data pipeline that handles stale data, prevents leakage, and produces trustworthy rankings every time.
In this blog post, we’ll break down how to build a robust Python stock screener in five structured steps. We’ll also explore how Quadratic enhances this process by combining Python execution, live data integration, and AI-powered analysis in a single environment, making it easier to build and operationalize your screener without fragmented tooling.
Why most Python stock screeners break down
Standard tutorials often treat stock screeners as one-off scripts. This approach inevitably leads to brittle and unreliable data pipelines. While customization is heavily emphasized in most guides, the real differentiator for analysts is building a solid data infrastructure and analytics strategy.
Without a workflow-first approach, factor definitions begin to drift. Handling missing data is frequently ignored, causing unexpected errors when market conditions shift. Over time, the scoring logic becomes an un-auditable black box that no one on the team can validate. The most effective approach flips this model. It requires defining a strict data schema and relying on rigorous validation checks to catch errors early.
Another common failure point is the lack of reproducibility and version control. As screeners evolve, small changes to factor weights or preprocessing steps can significantly alter results, yet these changes are rarely documented or tracked. This makes it difficult to compare outputs over time or trust the consistency of rankings. Building a robust screener requires treating it like a production system where every assumption and output is transparent and repeatable.
Step 1: Define your universe and data schema
The first step is to establish a clear initial stock universe. Filtering out irrelevant tickers early helps you manage financial API rate limits efficiently and reduces processing time.
Next, determine where your data will come from. You need reliable sources for both pricing and fundamental data, often by comparing financial APIs such as Yahoo Finance and Alpha Vantage.
Once your sources are set, design a structured output schema. This schema must correctly join daily market price data with quarterly or annual financial statements. Ensure your pipeline architecture is built to handle the differing frequencies of fundamental data versus market data without creating mismatched rows.
Step 2: Compute factors and handle messy data
With your data structured, you can programmatically calculate your chosen filtering metrics. These might range from basic technical indicators to fundamental risk-return ratios like the Sharpe and Sortino ratios.
Real-world financial data is rarely clean. You must implement explicit rules for handling missing data, ensuring that null values do not break your ranking logic or skew the final results.
It is equally important to account for corporate actions. Stock splits and dividends require you to properly adjust historical price windows so your calculations remain accurate. Finally, normalize your computed factors across the defined universe. Normalization allows for accurate, apples-to-apples comparisons between equities of different sizes and sectors, a key aspect of stock market analysis.
Step 3: Scoring, ranking, and filtering
Before ranking, apply hard rule-based filters to immediately eliminate stocks that fail to meet baseline liquidity or market cap requirements, narrowing your focus to viable candidates for stock research.
Next, design weighted composite scores or percentile ranks tailored to your specific investment style, whether that is value, growth, or dividend investing. Avoid relying on a single metric. Instead, combine multiple normalized factors into a unified ranking system.
Before finalizing your logic, run basic sensitivity testing. This ensures your final rankings do not wildly fluctuate based on minor changes to a single input variable.
Step 4: QA validation and backtest checks
A screener is only as useful as the trust you place in it. Implement explicit validation checks to catch data leakage, ensuring future data isn't accidentally used in historical factor calculations.
If you are running historical backtests, audit your screener against survivorship bias by verifying that delisted companies are accounted for.
Review the output for industry concentration. You want to ensure your screener isn't unintentionally selecting a single macroeconomic sector due to a skewed fundamental analysis. Always validate the stability of your outputs by manually reviewing a subset of the data before relying on the screener for actual analysis.
Step 5: Packaging outputs as repeatable templates
Move away from raw terminal outputs by structuring your final results into readable tables and organized watchlists.
Consider how the screener will be consumed visually. While you might acknowledge tools like Streamlit for building a UI, prioritize data transparency above all else.
Package the screener as a repeatable template so that parameters can be adjusted and the pipeline rerun without rewriting code from scratch, enabling spreadsheet automation. Ensure the final output format allows collaborators to easily review the logic, audit the data, and iterate on the workflow.
Building an auditable screener workflow in Quadratic
Quadratic transforms building a stock screener in Python into a fully auditable and reusable workflow. You can pull historical OHLCV data instantly using its stock market data connection, while easily integrating broader fundamental datasets from databases and APIs. It also combines spreadsheet formulas, code, and AI for a comprehensive data analysis. Let’s explore its features in detail.
Connect and standardize multi-source market data
Making a stock screener with Python begins with high-quality data. Quadratic allows you to pull live market data, fundamentals, and alternative datasets directly into the grid without relying on fragmented scripts. Instead of stitching together CSV files or maintaining separate ingestion pipelines, your entire data layer is centralized and continuously updated within the same workspace.
This makes it significantly easier to standardize schemas across sources. You can align pricing data, financial statements, and macro indicators into a consistent structure before applying any screening logic. As a result, your screener operates on clean datasets.
Build a custom Python screener with transparent logic
Quadratic enables you to implement your screening logic directly using native Python and SQL within the spreadsheet environment. Rather than relying on opaque formulas or rigid third-party tools, you can define exactly how factors such as valuation multiples, momentum indicators, or growth metrics are calculated.
Since the code executes alongside the data, every data transformation remains visible and auditable. You can trace each output back to its source inputs and logic without switching environments. This is critical when refining screening criteria or validating why specific stocks appear in your results.
Integrate technical and fundamental signals in one model
A common limitation in traditional workflows is the separation between technical analysis and fundamental data. Quadratic removes this barrier by allowing you to combine both seamlessly within the same model. You can calculate indicators such as moving averages or volatility alongside financial ratios like return on equity or earnings growth, all within a single environment.
This enables more sophisticated screening strategies. Rather than relying on isolated signals, you can construct multi-factor models that reflect a more complete view of market behavior and company performance.
Automate screening cycles and monitoring
Once your screener is defined, maintaining it manually becomes inefficient. Quadratic allows you to schedule your workflow to run automatically, ensuring that your results stay current as new market data becomes available. This transforms your stock screener from a one-time analysis into a continuously operating system.
Automated execution also enables consistent monitoring. You can track how your screened universe evolves and maintain a disciplined investment process without constant manual intervention.
Accelerate factor research with AI-assisted analysis
Developing a high-quality screener often involves iterating across multiple factor combinations. Quadratic’s AI capabilities streamline this process by helping you generate, test, and refine screening logic dynamically. You can prompt the system to evaluate metrics like revenue growth, margin expansion, or relative strength across a defined universe
This approach shifts your workflow from manual coding toward guided data exploration. Instead of spending time writing boilerplate scripts, you can focus on assessing which factors genuinely contribute to signal quality and robustness.
Let’s see how this works using Quadratic’s stock screener template:
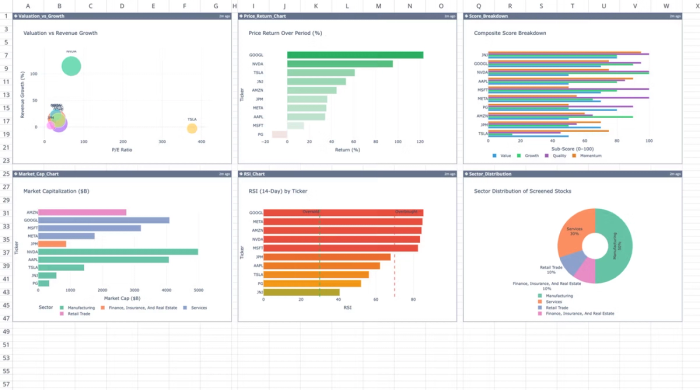
This template automates the extraction and analysis of financial data for up to ten custom ticker symbols. It calculates technical and fundamental metrics using live market data and historical stock data directly within Quadratic. Users can also perform custom analysis right within the spreadsheet:
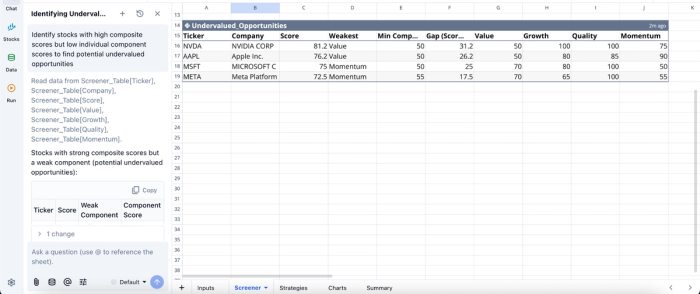
In this image, I ask Quadratic AI, “Identify stocks with high composite scores but low individual component scores to find potential undervalued opportunities.” It instantly creates a table that shows undervalued stock opportunities using metrics such as the value, growth, quality, and momentum.
Visualize screening outputs for rapid validation
Interpreting screener results requires more than a static list of tickers. Quadratic allows you to build dynamic financial data visualizations directly on top of your screened dataset, making it easier to validate patterns and identify outliers. You can chart factor distributions, compare performance across selected cohorts, and monitor how your criteria behave under different market conditions.
Since these visualizations are directly linked to your live data and logic, they update automatically as your inputs change. Visualizations in Quadratic can also be done by using text prompts:
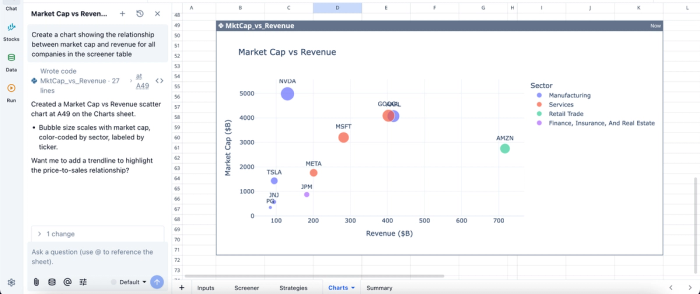
In this image, I ask Quadratic AI, “Create a chart showing the relationship between market cap and revenue for all companies in the screener table.” In seconds, it generates a scatter plot that shows the relationship between market cap and revenue.
Collaborate on screening logic in real time
Stock screening is rarely a solo activity in professional environments. Quadratic’s browser-based architecture allows analysts, researchers, and portfolio managers to work together on the same screener simultaneously. Team members can review logic, suggest adjustments, and validate outputs without dealing with version conflicts or fragmented communication.
This collaborative analytics platform accelerates iteration and improves model quality. By aligning stakeholders within a shared environment, you ensure that your screener reflects collective expertise rather than isolated assumptions.
Conclusion
A reliable stock screener requires rigorous attention to data schema design and continuous validation. Transitioning from a one-off script to a structured pipeline ensures your financial analysis remains accurate over time.
Build and share a Python-based stock screener in Quadratic that’s auditable and easy to iterate for stock market analysis. Try Quadratic for free.
Frequently asked questions (FAQs)
What makes creating a reliable stock screener with Python challenging?
Many initial attempts to create a stock screener with Python often treat it as a one-off script, which leads to unreliable data pipelines. This approach frequently results in issues like drifting factor definitions, unhandled missing data, and un-auditable scoring logic as market conditions change.
How can I ensure my Python stock screener is reusable and accurate?
To build a reusable and accurate Python stock screener, you must define a strict data schema and a clear stock universe from the start. Implement explicit rules for computing factors, handling messy data, and normalizing results, followed by rigorous QA validation and packaging the output as repeatable templates.
How does Quadratic help you create a stock screener with Python that is auditable?
Quadratic transforms a standard Python stock screener script into a fully auditable and reusable workflow within a collaborative spreadsheet environment. You can pull historical OHLCV data instantly using its stock market data connection and leverage the built-in AI assistant to draft Python code for complex data retrieval and factor computation directly in the grid.