
James Amoo, Community Partner
Apr 30, 2026

Table of contents
- Alpha Vantage for stock market analysis
- Why analysts and developers seek Alpha Vantage alternatives
- Core criteria for evaluating financial data APIs
- How Quadratic streamlines the financial data workflow
- Alpha Vantage vs Quadratic for stock market analysis
- Build a better market data pipeline
- Frequently asked questions (FAQs)
Financial API integration can be a major source of frustration for developers and analysts. Unreliable endpoints, unexpected rate limits, and tedious data formatting often get in the way of actual analysis. When these issues compound, many teams start looking for an Alpha Vantage alternative to keep their financial models and dashboards running smoothly.
Quadratic goes beyond being just another data source by combining built-in stock market data access with AI-powered analysis and spreadsheet workflows. This makes it a strong alternative for teams that want to move from managing APIs to stock market analysis in a single environment.
This article covers the essential criteria for evaluating new market data providers and explores how upgrading your data-to-insight workflow can permanently eliminate the friction of traditional API management.
Alpha Vantage for stock market analysis
Alpha Vantage is a widely used financial data API that provides access to real-time and historical market data across equities, forex, cryptocurrencies, and macroeconomic indicators. It is particularly known for its rich set of technical indicator endpoints, allowing users to compute indicators such as RSI, MACD, moving averages, and Bollinger Bands directly through API calls without implementing the calculations manually.
In addition to this, Alpha Vantage live data also offers fundamental data, including company overviews and financial statements, making it a versatile option for both quantitative and fundamental analysis. It excels in enabling rapid prototyping and lightweight financial data analytics.
Why analysts and developers seek Alpha Vantage alternatives
Several common catalysts push teams to migrate away from their current data provider. Finding an Alpha Vantage Excel add in usually comes down to solving specific operational pain points that hinder productivity.
Strict rate limits are a frequent trigger. When you are scaling financial models, hitting a call cap can bring your entire process to a halt. Gaps in data coverage also drive users to seek new solutions. This might manifest as unacceptable latency in real-time feeds or missing historical data for niche asset classes.
Another major factor is the lack of workflow integration. Alpha Vantage Python, like many API-first tools, focuses on delivering raw data rather than enabling end-to-end analysis. This means teams must stitch together multiple tools for storage, transformation, modeling, and visualization. Over time, this fragmented setup creates inefficiencies and increases the risk of stale data between datasets and outputs.
The Alpha Vantage cost scalability can also become a concern as usage grows. While initial Alpha Vantage pricing tiers may seem accessible, increased API calls or higher-frequency data requirements can lead to rising costs. This creates a trade-off between maintaining performance and controlling expenses, especially for teams running data-intensive applications or supporting multiple users.
Alpha Vantage still excels as an accessible and developer-friendly entry point into financial data. Its built-in technical indicators and straightforward API structure make it ideal for lightweight applications. For individual developers or small projects, it remains a practical and efficient solution for quickly accessing market data without significant upfront investment.
Core criteria for evaluating financial data APIs
Selecting a new market data provider requires a structured approach. The best choice depends heavily on your specific use case and user profile. An algorithmic trader, a student running a research project, and a developer building a fintech app all have vastly different requirements. When evaluating financial data feeds, it is crucial to balance the need for deep historical data with the demand for real-time accuracy.
Data coverage and asset classes
Begin by assessing the API's breadth across different markets. Ensure the provider offers robust coverage for the asset classes you actually trade or analyze, whether that means global equities, forex, or cryptocurrency.
Beyond raw price points, look at the available data types. A comprehensive provider should supply detailed OHLCV (open, high, low, close, volume) data, alongside company fundamentals and technical indicators. It is also important to check the provider's historical data limits. Look closely at their methodology for handling corporate actions, ensuring they provide accurate adjustments for stock splits and dividends.
Rate limits, latency, and reliability
Rate limits often dictate whether an API is merely suitable for prototyping or robust enough for a production environment. Evaluate how many calls you can make per minute and whether those tiers align with your computing needs.
You also need to consider the delivery method. REST APIs are typically sufficient for historical research and end-of-day analysis. However, if your strategy requires WebSockets for low-latency, real-time updates, you will likely need a provider that offers this technology. Finally, review the provider's uptime SLAs and search for community feedback regarding data accuracy, service outages, and how frequently the API returns missing values.
The hidden cost: API management and infrastructure
Evaluating the endpoint itself is only part of the equation. The hidden cost of any financial data API lies in the management and infrastructure required to keep it running smoothly, often presenting significant data exploration challenges in financial data engineering.
Building robust data pipelines is rarely as simple as making a single GET request. Developers must write logic to handle rate-limit backoffs, manage complex pagination for large historical datasets, and parse nested JSON responses. The true cost of a market data provider includes the countless engineering hours spent maintaining the connection and troubleshooting broken extraction scripts.
How Quadratic streamlines the financial data workflow
When evaluating alternatives to API-first providers like Alpha Vantage API Python, the challenge is what happens after the data is retrieved. Quadratic offers an integrated analysis environment that bypasses the need for traditional API plumbing. By combining the familiar interface of a spreadsheet with native Python and AI, it fundamentally changes how financial professionals interact with market data. Let’s explore the features of Quadratic in detail.
Build dynamic equity research workspaces
Quadratic allows you to import financial statements, market data, and company metrics directly from multiple live sources into a structured grid. These datasets remain connected and automatically update as new information becomes available.
This approach turns traditional research documents into dynamic systems. Instead of rebuilding models every earnings cycle, your analysis evolves continuously with the market.
Align price action with business performance
Quadratic enables you to analyze historical price movements alongside fundamental and technical data in the same environment. You can compute technical indicators while tracking earnings and cash flow trends.
This combined perspective helps investors validate both momentum and intrinsic value. It removes the disconnect between SQL charting tools and financial models.
Build your own screening logic with code
Instead of relying on rigid filters, Quadratic allows you to build custom stock screeners using Python and SQL. You can combine technical signals with fundamental thresholds in a single model.
This flexibility ensures your screening process reflects your exact strategy. As market conditions shift, your logic can evolve without constraint.
Use AI to surface insights across your watchlist
You can instruct Quadratic’s AI to evaluate companies across key metrics such as growth, profitability, and valuation. It can highlight trends, rank opportunities, and identify anomalies within a portfolio.
This accelerates decision-making by reducing manual analysis. Rather than manually comparing dozens of metrics, you can generate structured insights instantly and refine them interactively. Let’s see how this works using Quadratic’s stock market analysis template:
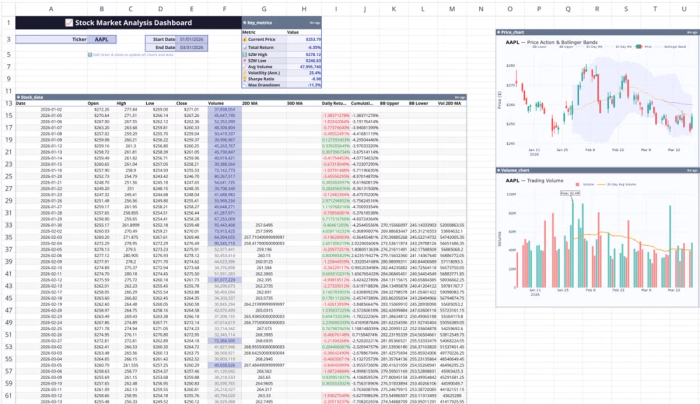
This template includes ready-made features for real-time stock data visualization, technical indicator calculations (RSI analysis), price trend analysis, and volume analysis. All you have to do is input the company’s ticker, and the data updates automatically. You can also perform advanced analysis on this data using simple text prompts:
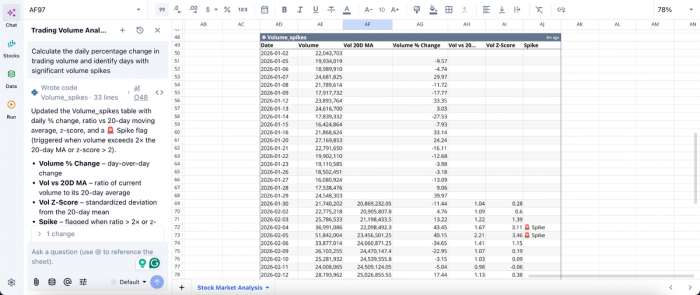
In this image, I ask Quadratic AI to “Calculate the daily percentage change in trading volume and identify days with significant volume spikes”. It instantly generates a table that gives a breakdown of volume spikes across the 30-day window, showing days where a spike occurs.
Create responsive charts tied to live data
Quadratic enables you to build charts for price trends, financial performance, and custom indicators directly within the workspace. These financial data visualizations update automatically as underlying data changes.
This ensures your analysis is always aligned with the latest market conditions, without requiring manual refreshes or exports. Visualization in Quadratic can also be generated using simple text prompts:
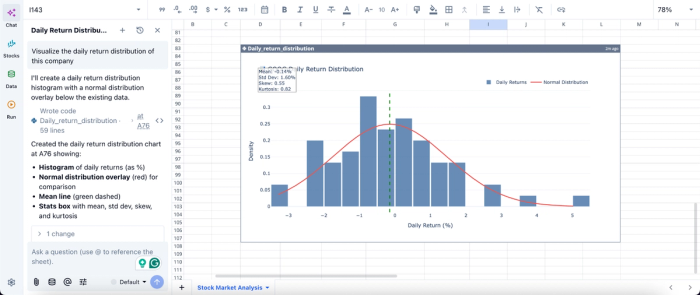
In this image, I ask Quadratic AI to “Visualize the daily return distribution of this company”. It creates a histogram of the daily returns alongside the normal distribution overlay. This helps analysts easily understand the insights generated from raw data.
Automate recurring research and data workflows
Quadratic allows you to schedule tasks and analysis processes, ensuring your models and dashboards stay up to date automatically.
This shifts your workflow from reactive updates to continuous monitoring, enabling faster and more consistent decision-making.
Collaborate on investment analysis in real time
Quadratic operates as a collaborative analytics platform where teams can work on the same models simultaneously. Analysts can review assumptions, validate outputs, and iterate together.
This eliminates version control issues and improves alignment across teams. Everyone works from the same source of truth.
Alpha Vantage vs Quadratic for stock market analysis
In this section, we will explore how Alpha Vantage and Quadratic compare, helping you choose the best tool for your workflow.
| Metric | Alpha Vantage | Quadratic |
|---|---|---|
| End-to-end analysis workflow | Data provider only; requires separate tools for analysis and dashboards | Unified environment for data ingestion, modeling, visualization, and reporting |
| Setup and configuration | Requires API keys, request handling, and custom integration logic | Minimal setup; start analyzing immediately in a spreadsheet-like interface |
| AI-assisted financial analysis | No native AI; users must build their own analytical layer | Built-in AI for generating insights, models, and comparisons across stocks |
| Handling time-series market data | Provides time-series endpoints, but analysis must be done externally | Native support for time-series analysis directly in the grid with automation |
| Financial statement integration | Offers endpoints, but structuring and modeling require additional work | Combines income statements, balance sheets, and cash flows seamlessly with analysis tools |
| Visualization | No visualization layer; requires BI tools or custom charting libraries | Built-in dynamic charts and dashboards tied directly to live data |
| Collaboration | Real-time collaboration with a single and auditable source of truth | Collaboration handled outside the API |
Build a better market data pipeline
Choosing the right data source is only the first step in building a reliable financial model. While finding a suitable Alpha Vantage alternative can resolve immediate issues with rate limits or data coverage, the underlying workflow is what ultimately determines your team's efficiency.
An integrated workspace offers a vastly superior workflow compared to managing a fragmented API stack. By bringing extraction, analysis, and visualization into a single environment, you can eliminate pipeline maintenance and accelerate your time to insight. Quadratic allows you to automatically ingest live data and perform advanced AI-powered stock market analysis without managing a separate API-to-dashboard stack. Try Quadratic for free.
Frequently asked questions (FAQs)
Why do financial professionals often seek an Alpha Vantage alternative?
Teams commonly look for an Alpha Vantage alternative when facing operational pain points like strict rate limits that halt processes or unacceptable data latency. The technical burden of handling inconsistent data formats and maintaining complex API infrastructure also frequently drives the search for new solutions.
What are the crucial criteria for evaluating a new financial data API provider?
When evaluating a new provider, it is essential to assess data coverage across relevant asset classes, including historical depth and real-time accuracy. You should also consider rate limits, the availability of low-latency delivery methods like WebSockets, and the overall reliability of the service.
How does Quadratic streamline the process of working with financial market data?
Quadratic streamlines financial data workflows by providing an integrated analysis environment that combines a spreadsheet interface with native Python and AI. This allows users to pull and analyze rich market data directly within the grid, eliminating the need for separate extraction scripts and reducing the complexities of traditional API management.