
James Amoo, Community Partner
Apr 17, 2026

The stock market produces an overwhelming amount of data every minute, requiring robust financial data analytics. For swing traders, manually sifting through thousands of tickers to find the right setups is an impossible task. To navigate this noise, you need a systematic data analytics strategy. A reliable stock screener for swing trading enforces objective and mathematical filters to produce a consistent watchlist and solid data infrastructure and analytics strategy.
The best stock screener for swing trading is a structured workflow for predictive analytics that narrows the market down to high-probability setups based on your exact rules. In this article, we will cover how to define strict screening criteria, compute technical indicators transparently, and operationalize a repeatable workflow through spreadsheet automation that keeps your trading disciplined.
The limitations of black-box screening tools
Many traders start their forecasting journey by looking for a free stock screener for swing trading. While accessible, these platforms often act as opaque black boxes. They offer pre-built filters and proprietary scores, but rarely reveal their underlying mathematical computations.
When you use hidden algorithms or subjective visual chart scanning, your resulting watchlists become inconsistent. If you do not know exactly how a momentum score is calculated, you cannot trust it when real capital is on the line. The best free stock screener for swing trading is a system you build yourself. By adopting a rule-based workflow where every indicator and financial reporting is explicitly defined, you can audit your logic and ensure your screener operates exactly as intended.
Another key limitation of black-box screeners is their lack of flexibility. Most platforms restrict you to a fixed set of indicators and predefined conditions, which may not align with your specific strategy or risk tolerance. As your trading approach evolves, you may find it difficult to adjust these tools to reflect new ideas or incorporate custom metrics. This can slow down your development as a trader and limit your ability to refine an edge.
There is also the issue of reproducibility and backtesting. With opaque tools, it is often unclear whether the same inputs will consistently produce the same outputs over time. This makes it difficult to validate strategies or learn from past performance. In contrast, a self-built workflow allows you to run controlled tests and make incremental improvements based on clear rules.
How to set up a stock screener for swing trading
Before configuring any software, you need the right foundational mindset and an understanding of a stock scanner vs screener. A screener is essentially a funnel designed to aggressively narrow thousands of available tickers down to a highly selective few.
Learning how to set up stock screener for swing trading starts with defining a clear trading thesis. Are you looking for pullbacks in an uptrend or momentum breakouts? Your thesis dictates your math. Once your strategy is clear, you can implement the best stock screener settings for swing trading by building your funnel in three distinct phases: baseline liquidity, trend and momentum, and risk constraints.
Phase 1: Baseline liquidity and volume constraints
Liquidity is the non-negotiable first step in any screening process. If a stock does not trade with enough volume, you face severe execution risk and slippage when entering or exiting a position.
To protect your capital, establish objective baseline parameters. For example, you might require a minimum average daily volume (ADV) of 500,000 shares and a minimum market capitalization of $300 million. This immediately removes illiquid penny stocks and erratic micro-caps from your universe. You should also filter by specific exchanges or regions to match your target market. For instance, if you are trading in specific international markets, the best stock screener for swing trading India will allow you to restrict your universe strictly to the NSE or BSE, ensuring your liquidity metrics align with regional trading volumes.
Phase 2: Trend and momentum indicators
Once you have a liquid universe, the next phase is identifying directional movement. Systematic swing traders rely on a core trifecta of price, trend, and momentum, which can also serve as the foundation when using machine learning for stock selection.
Start by explicitly computing and applying moving averages to establish the baseline trend. Next, layer in momentum oscillators like the Relative Strength Index (RSI), Moving Average Convergence Divergence (MACD), or Average Directional Index (ADX). These technical indicators help identify setups without overcomplicating the criteria. The best stock screener filters for swing trading use these mathematical constants to strip away emotion and objectively highlight stocks with the right technical posture.
Phase 3: Volatility caps and risk management
A professional screener does more than find opportunities; it incorporates embedded risk constraints before a trade is ever placed. This is where volatility filters come into play.
By calculating metrics like the Average True Range (ATR), you can cap your exposure to erratic price swings. If a stock's ATR is too high relative to its price, the position might be too volatile for your risk parameters. Furthermore, you can use these volatility metrics as proxies for stop-loss distance. If your strategy requires a stop-loss placement that exceeds your maximum acceptable account risk based on the ATR, the screener should automatically filter that ticker out. Embedding risk management directly into the best stock screener criteria for swing trading ensures that every setup on your final list aligns with your risk tolerance.
How to use a stock screener for swing trading
Understanding how to use stock screener for swing trading effectively requires strict daily or weekly mechanics. Depending on your timeframe, you should run your screener at a consistent time to prepare for the upcoming sessions.
The most critical component of this workflow is psychological discipline. You must trust the screener's output and avoid the temptation to manually override your objective rules just because you have a feeling about a particular company. Also, it is vital to log your historical screener outputs when tracking stock performance. By keeping a record of which stocks passed your filters on any given day and tracking their subsequent performance, you can validate your system over time and make data-driven adjustments to your criteria.
Another important aspect is aligning your screener criteria with current market conditions. A strategy that works well in a trending market may underperform in a sideways or highly volatile environment. For example, momentum-based filters might generate strong candidates during bullish periods but produce false signals when the market lacks direction. Regularly reviewing the broader market context helps you interpret your screener results more effectively.
It is also essential to define clear post-screening rules for trade selection and execution. Your screener should only narrow down opportunities, not make final decisions for you. Establish criteria for entry points, position sizing, and risk management before placing any trades. This ensures that every stock passing your screener is evaluated consistently.
Building an auditable stock screener in Quadratic
An objective swing trading screener is only as strong as its ability to produce explainable results. Many traders rely on opaque tools where screening logic is hidden behind prebuilt filters, driving the need for a MarketXLS alternative that makes it easier to validate why a stock was selected. Quadratic addresses this by giving you full visibility into both the data and the logic driving your screener.
By consolidating data exploration and financial data visualization into a single environment, Quadratic enables you to build a screener that is not only automated but fully auditable. Every signal, ranking, and exclusion can be traced back to a clearly defined rule. Let’s explore other features of Quadratic.
Direct connections to financial data sources
Quadratic allows you to pull in live stock market data directly into your screener without relying on manual imports. This ensures that your screening universe is always based on the most current and comprehensive dataset available, making it a powerful Alpha Vantage alternative.
By integrating multiple data sources within one environment, you can combine technical and fundamental criteria seamlessly without needing a separate stock screener API. This creates a more robust screening model that reflects a broader view of market conditions.
Deterministic rule tracking and audit trails
Every screening condition in Quadratic is explicitly defined and stored within the file, creating a clear audit trail of how results are generated. This eliminates the ambiguity often associated with black-box screening tools.
If a stock appears in your results, you can trace exactly which conditions it met and why. This is critical for maintaining discipline and trust in your trading system.
Automated screening and scheduled execution
Quadratic allows you to automate the execution of your screener using its scheduled tasks feature, running it at predefined intervals such as after market close or before the trading day begins. This ensures consistent application of your strategy.
This automation software removes the need for manual intervention and reduces the risk of missed opportunities. Instead of manually updating stock data in Excel, your screener becomes a reliable system that continuously scans the market on your behalf.
AI-powered data analysis
Quadratic enables you to define screening criteria using AI agents for data analysis, allowing you to generate conditions such as momentum thresholds, breakout patterns, or volatility filters without manually coding each rule.
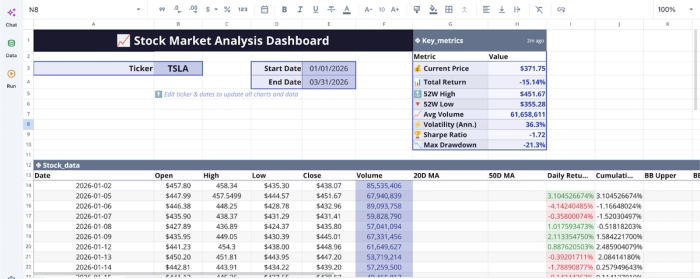
This reduces the complexity of building multi-factor screeners while maintaining precision, effectively acting as a verifiable AI stock picker. You can quickly iterate on your strategy and test new ideas without disrupting your existing workflow. Let’s see how this works using Quadratic’s built-in stock market analysis template:
This template provides users with ready-made features for stock screening. These include real-time stock data visualization, technical indicator calculations, trend analysis, and more. Even with all these provided out of the box, users can still conduct custom stock analysis by using text prompts. Here:
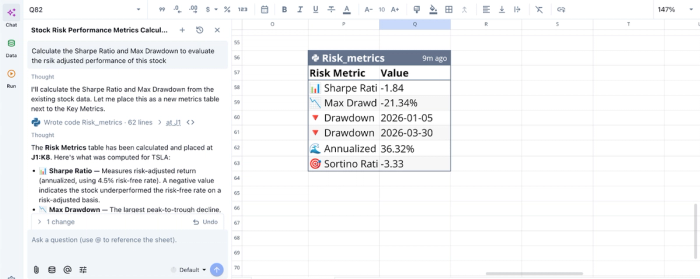
Here, I ask Quadratic to “Calculate the Sharpe Ratio and Max Drawdown to evaluate the risk-adjusted performance of this stock.” It instantly generates a table of risk metrics, including Sharpe ratio, maximum drawdown, and annualized volatility. This template is available (and automatically updates) for all popular stock tickers.
AI data visualization
Once your screener produces results, Quadratic allows you to visualize key metrics such as price trends, volume spikes, and indicator signals directly alongside your filtered list of stocks.
These visual layers make it easier to validate whether your screening logic is capturing the intended patterns. Instead of relying solely on research and data analysis, you can visually confirm the quality of each signal. Let’s see how we can create visualizations in Quadratic:
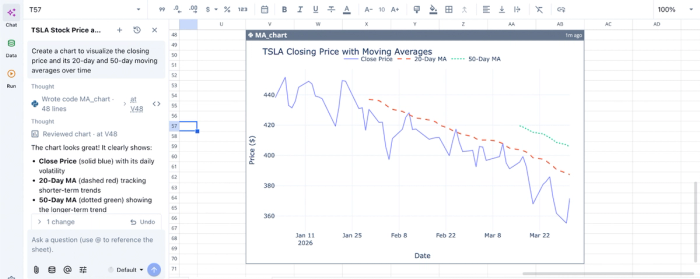
In this image, I ask Quadratic to “Create a chart to visualize the closing price and its 20-day and 50-day moving averages over time.” It instantly generates a chart showing the trend of TSLA’s closing price with moving averages. Quadratic intelligently selects the most appropriate chart type for your dataset.
Native support for programming languages
Quadratic’s native support for Python and SQL enables you to implement advanced screening logic beyond standard spreadsheet formulas. You can build custom indicators, ranking systems, and scoring models tailored to your specific trading strategy.
This is essential for swing trading, where nuanced conditions often determine entry and exit points. By combining SQL for data analysis with spreadsheet logic, you can create a screener that is both powerful and transparent.
Collaboration and shared screening models
Quadratic supports collaborative workflows, allowing multiple users to contribute to and refine the same screener. Team members can review logic and validate outputs in real time.
This collaborative analytics platform ensures that screening methodologies remain consistent across users. It also creates a centralized system where strategies can be documented and improved collectively.
Conclusion
Replacing subjective chart-reading with a data-driven workflow is the key to long-term survival in the markets. A robust stock screener for swing trading does not exist to predict market movements with absolute certainty; its purpose is to enforce consistency and save you from the pitfalls of emotional decision-making.
When you define strict liquidity constraints and clear volatility caps, you transform a chaotic market into a high-probability watchlist. Quadratic allows you to take control of your trading logic without relying on black-box algorithms. Try Quadratic for free.
Frequently asked questions (FAQs)
What is the main benefit of using a stock screener for swing trading?
A stock screener for swing trading helps traders systematically filter through thousands of market tickers to identify high-probability setups based on mathematical rules. This process eliminates subjective manual sifting, providing a consistent watchlist and enforcing trading discipline.
Why is transparency important when choosing a stock screener for swing trading?
Transparent screening tools reveal the exact mathematical computations behind their filters and indicators, unlike opaque black-box platforms often found when searching for a free stock screener for swing trading. This allows traders to audit their logic and build trust in their system.
How can Quadratic help you build an objective stock screener for swing trading?
Quadratic provides an environment to build a transparent stock screener for swing trading by allowing users to pull live stock data and compute custom technical indicators using native Python, SQL, or spreadsheet formulas. This ensures your entire screening workflow is auditable, enabling you to clearly see and iterate on your logic for robust analysis.