
James Amoo, Community Partner
May 19, 2026

Table of contents
- Moving beyond generic screeners: Why build custom?
- Evaluating market data APIs for your screener
- Step-by-step: Constructing your custom screener workflow
- The dashboard dilemma: Visualizing your strategy
- How Quadratic fits: A unified workspace for custom screeners
- Conclusion: Prototype your next strategy
- Frequently asked questions (FAQs)
Off-the-shelf financial platforms are great for retail investors looking at basic price-to-earnings ratios, but they fall short when you need to execute a solid data infrastructure and analytics strategy. When your thesis relies on highly specific criteria, generic tools simply cannot keep up.
The solution is leveraging a stock screener API to build an objective stock screener for trading. By taking control of the data pipeline, you unlock the flexibility to define precise parameters, integrate proprietary factors, and tailor your entire analytical process. This guide will cover financial API use cases, how to select API sources, define custom logic, integrate disparate data, and visualize your results without the heavy development overhead of building a web app from scratch.
Moving beyond generic screeners: Why build custom?
Quants, analysts, and product teams often hit a wall with standard screening platforms. These tools restrict you to predefined metrics and rigid filtering logic, making it difficult to test nuanced market hypotheses.
To uncover unique market opportunities, you need the ability to define precise criteria and integrate proprietary scoring algorithms for predictive analytics. Basic threshold screening is no longer enough. You need a programmable environment to handle multi-variable filters. Building custom API solutions for screening stocks by valuation or growth metrics allows you to combine specific financial logic programmatically, isolating distinct market opportunities that standard platforms miss.
Quadratic bridges the gap between spreadsheet accessibility and programmatic flexibility. Instead of being confined to static filters, analysts can integrate live market data, write custom scoring models, and build dynamic Python stock screening workflows directly within the spreadsheet environment. This enables teams to prototype a Python stock tracker and refine sophisticated investment logic faster, while maintaining full transparency into the calculations and assumptions driving the results.
Evaluating market data APIs for your screener
Optimizing your data analytics strategy is the foundation of your custom workflow. When evaluating an API, such as comparing Alpha Vantage vs Finnhub, focus on data accessibility and how easily you can handle multiple endpoints for pricing, fundamentals, and economic data.
Many developers start their journey by searching for a free stock screener API. While a stock screener API free tier is useful for initial prototyping, these plans typically lack the rate limits and real-time execution speeds required for heavy programmatic use.
Historically, analysts often looked for a Google Finance stock screener API or a Yahoo stock screener API to pull basic market data. However, modern REST APIs provide much better programmatic access than yfinance Python workflows. Specialized market data providers and yfinance alternatives now offer cleaner documentation and more reliable endpoints for building robust screening tools.
Step-by-step: Constructing your custom screener workflow
Building a custom screening tool requires a linear progression from raw data exploration to actionable insights. The following steps provide a hands-on approach for developers and analysts looking to construct a reliable stock screener API workflow.
Step 1: API setup and data ingestion
The first step is authenticating and connecting to your chosen market data API, rather than trying to scrape stock data. This is typically done using Python libraries like Requests or standard HTTP protocols.
You will need to pull a variety of raw datasets, such as Polygon stock data, to build a comprehensive view of the market. This includes financial statements, technical indicators, and macroeconomic metrics. Establishing structured data early in the process is critical, as it serves as the foundation for any custom screening tool. Ensure your ingestion scripts handle pagination and standardize data types before moving to the analysis phase.
Step 2: Defining custom filters and proprietary factors
Once your data is ingested, you can use Python or SQL to write multi-variable filtering logic. This is where you move beyond standard metrics to compute proprietary scoring algorithms based on your unique thesis requirements.
Instead of just filtering for a low P/E ratio, you might write code that weighs historical revenue growth against sector-specific debt metrics. By combining these variables, you can build highly specific API solutions for tracking stocks by valuation or growth metrics. This level of customization allows you to rank and score assets exactly how your strategy dictates.
Step 3: Integrating multiple data sources
A truly comprehensive screening strategy often requires merging disparate data feeds, such as a stock news API. For example, you might need to combine live pricing data from one API endpoint with fundamental SEC filings from another.
This introduces the technical challenge of aligning timestamps across different time zones and handling stale data. Merging multiple APIs into a multi-source dataset is crucial. It allows you to build a robust screening strategy that off-the-shelf tools cannot replicate, giving you a clearer picture of market dynamics.
The dashboard dilemma: Visualizing your strategy
Most developer tutorials for building a stock screening API culminate in building an interactive front-end from scratch, such as a Streamlit app or a custom messaging bot.
However, traditional software development carries a heavy overhead. Deploying and maintaining these investment portfolio dashboards introduces constant friction, especially when analysts need to tweak a single parameter or add a new column to their view. Analysts require a transparent interface where they can interact with the data and validate their logic without relying on an engineering team for constant UI code updates.
This challenge becomes even more pronounced as strategies evolve. In rigid dashboard architectures, even small adjustments can require backend modifications and additional testing. As a result, teams spend valuable time maintaining interfaces instead of iterating on the actual investment strategy, slowing down research velocity and reducing operational agility.
How Quadratic fits: A unified workspace for custom screeners
Quadratic provides an ideal hybrid environment that bridges the gap between spreadsheet flexibility and financial data analytics. It combines the familiarity of a stock tracking spreadsheet with native Python, SQL, and formulas in a single grid. Let’s explore the features of Quadratic in detail.
Connect directly to stock screener APIs and live market datasets
A modern custom screener depends on reliable access to financial data. Quadratic allows you to connect directly to stock market data, market databases, and financial data providers within the spreadsheet environment.
Instead of manually exporting CSVs or maintaining disconnected API scripts, you can stream live prices, company fundamentals, macroeconomic indicators, and financial news via a stock market news API into one continuously updating workspace. This makes it easier to build a screener that evolves alongside changing market conditions rather than relying on static snapshots of data or manual stock quotes in Excel.
Build proprietary scoring models with Python inside the spreadsheet
Most off-the-shelf screeners limit users to predefined filters. Quadratic removes this constraint by allowing you to build custom analytical logic using spreadsheet formulas, Python, and SQL for data analysis directly in the same environment.
You can create proprietary ranking systems that combine valuation metrics, growth factors, and momentum signals into a single composite score. Instead of juggling external notebooks or standalone scripts, your calculations run directly beside the underlying market data.
For example, you can create a multi-factor model that prioritizes companies with expanding operating margins and relative price strength over a specific timeframe. This enables investors to develop screening systems that are genuinely differentiated rather than variations of generic market filters.
Keep data, logic, and outputs fully auditable
One of the biggest weaknesses of many screening platforms is the lack of transparency. Proprietary tools often obscure how rankings are calculated or how datasets are processed internally. Quadratic addresses this by keeping every layer of your workflow inspectable.
Your API connections, Python scripts, and ranking outputs all exist within the same workspace. This makes it easier to validate assumptions and maintain confidence in your analytical process. For investors managing complex strategies, this transparency is critical for maintaining methodological discipline and ensuring consistency across research workflows.
Automate refresh cycles and recurring screening workflows
Manual refreshes quickly become unsustainable as a screener grows more sophisticated. Quadratic supports scheduled tasks, allowing your API pulls, calculations, and dashboards to refresh automatically in the background.
This ensures that your rankings and research outputs always reflect the latest market conditions without requiring manual intervention. Automated workflows also make it easier to scale your analysis across larger universes of stocks while maintaining operational consistency.
Use AI to accelerate screener development and hypothesis testing
Developing custom screening strategies often involves extensive experimentation. Quadratic’s AI-powered environment helps accelerate this process by assisting with data transformation, code generation, and Python exploratory data analysis.
You can ask the AI to generate Python logic for ranking stocks to build an AI stock picker, identify unusual factor relationships, compare valuation trends across sectors, or highlight correlations between technical and fundamental indicators. Instead of spending hours writing repetitive boilerplate code, you can rapidly prototype and refine ideas while retaining complete visibility into the generated logic.
Let’s see how this works using Quadratic’s built-in stock screener template:
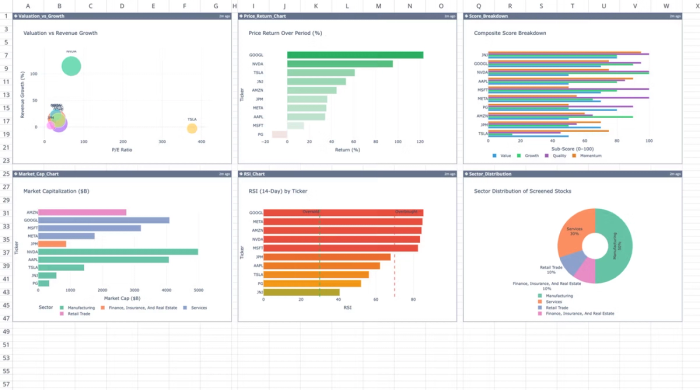
This template automates the extraction and analysis of financial data for up to ten custom ticker symbols. It calculates technical and fundamental metrics using live market data and historical stock data directly within Quadratic. Users can also perform custom analysis by using text prompts:
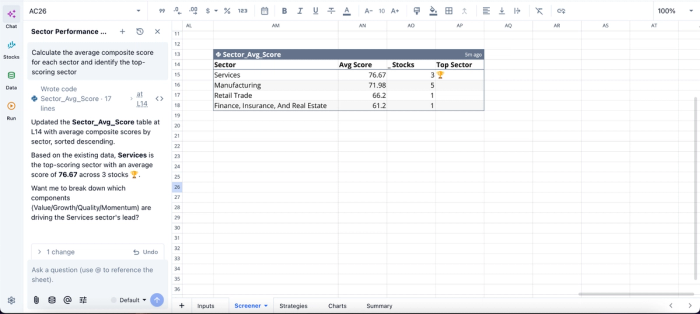
In this image, I ask Quadratic to “Calculate the average composite score for each sector and identify the top-scoring sector.” It generates a table that shows the average score for each sector and the number of stocks in that particular sector.
Visualize factor performance and screening outputs dynamically
A screening model becomes significantly more powerful when its outputs are easy to interpret visually. Quadratic allows you to build financial data visualizations and live dashboards directly on top of your screener data.
You can visualize factor distributions, monitor ranking changes over time, or track how screened portfolios perform relative to benchmarks. Because these dashboards are connected directly to live data pipelines, they update automatically as the underlying market data changes.
This transforms your screener into an interactive research environment capable of supporting both exploratory analysis and ongoing portfolio monitoring. Visualization in Quadratic can also be done by using text prompts:
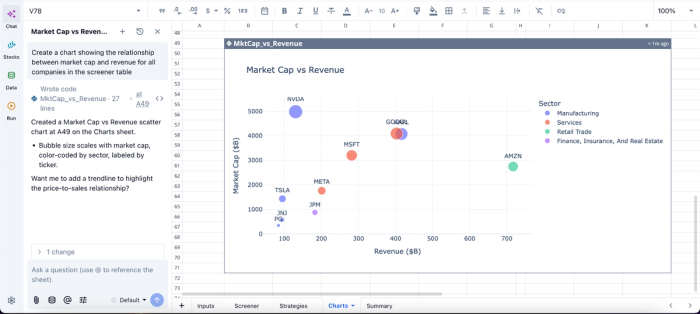
In this image, I ask Quadratic AI to “Create a chart showing the relationship between market cap and revenue for all companies in the screener table.” In seconds, it creates a scatter chart that gives visual insights into the relationship between market cap and revenue.
Collaborate on screening models in real time
Custom screeners are often built collaboratively across research teams, advisors, or investment committees. Quadratic’s browser-based multiplayer environment enables multiple users to work on the same screener simultaneously.
Team members can review ranking methodologies, adjust factor weights, refine valuation logic, and annotate investment ideas directly within the shared workspace. This collaborative structure reduces version-control issues and keeps the entire research process centralized and transparent.
Conclusion: Prototype your next strategy
Building a custom stock screener API gives you a clear strategic edge over generic platforms. By combining the flexibility of modern market data APIs with a unified workspace, you eliminate the friction of traditional dashboard development while retaining full control over your screening logic and analysis pipeline.
Instead of being constrained by rigid filters or opaque ranking systems, you can design auditable workflows that evolve with your investment strategy.
With Quadratic, you can prototype and operationalize this entire workflow in one place, building stock screener APIs with transparent filters and dynamic dashboards that update in real time. Try Quadratic for free.
Frequently asked questions (FAQs)
Why should I build a custom stock screener API instead of using off-the-shelf platforms?
Off-the-shelf financial platforms often fall short when executing unique investment strategies because they restrict you to predefined metrics and rigid filtering logic. A custom stock screener API provides the flexibility to define precise parameters and tailor your entire analytical process for nuanced market hypotheses.
How can I define unique filters and integrate multiple data sources for my stock screening API?
You can define unique filters by using Python or SQL to write complex filtering logic after ingesting your data. This allows you to compute proprietary scoring algorithms that go beyond standard metrics, creating highly specific API solutions for screening stocks by valuation or growth metrics.
How does Quadratic support building a custom stock screener API workflow?
Quadratic provides a unified workspace that combines the familiarity of a spreadsheet with native Python, SQL, and formulas, allowing direct connection to stock market data. This environment enables you to pull rich datasets and compute proprietary scoring algorithms directly alongside your raw data for instant validation.