Purpose of the stock screener template
This template automates the extraction and analysis of financial data for up to ten custom ticker symbols. It calculates technical and fundamental metrics using live market data and historical financial statements directly within Quadratic.
By evaluating these metrics, the template generates a weighted composite score for each stock based on Value, Growth, Quality, and Momentum factors. It also visualizes stock performance, sector distribution, and scoring breakdowns through dynamically generated charts, and produces a text-based summary highlighting top performers, passing strategies, and flagged risks.
How the template works
The template operates on a unidirectional data flow across five interconnected sheets. It uses the Inputs sheet as the sole source of user-defined parameters, ensuring all downstream analysis updates automatically when you change your criteria.
These static inputs feed into the Screener sheet, which utilizes a single Python cell to execute asynchronous q.financial API calls. To handle cross-company reporting inconsistencies, the code uses fallback key chains for financial statement tags. The compiled Screener output is then distributed to the Strategies, Charts, and Summary sheets for downstream evaluation and visualization.
Core components of the template
Inputs sheet
The Inputs sheet contains user-editable static values with no underlying code. It holds up to ten ticker symbols and custom start and end dates for the historical analysis period.
- Includes thirteen screening criteria rows with optional minimum and maximum thresholds.
- Stores four composite score weight percentages mapped to Value, Growth, Quality, and Momentum.
Screener sheet
The Screener sheet runs a single Python code cell that reads all parameters from the Inputs sheet. It fetches real-time price, historical prices, and two fiscal years of financial statements, including income, balance sheet, and cash flow data.
- Computes derived price metrics like period return, annualized volatility, maximum drawdown, 14-day RSI, moving averages, and volume trends.
- Extracts fundamental metrics such as revenue growth, EPS growth, margins, market cap, ROE, free cash flow, and dividend yield.
- Calculates four heuristic-based sub-scores from 0 to 100 and aggregates them into a final weighted composite score.
- Outputs a 37-column DataFrame sorted in descending order by the composite score.
Strategies sheet
This sheet uses a Python cell to read the Screener output DataFrame. It evaluates each stock against five boolean strategy filters using hardcoded thresholds. The output is a table displaying pass and fail emoji indicators alongside a total count of passed screens per ticker.
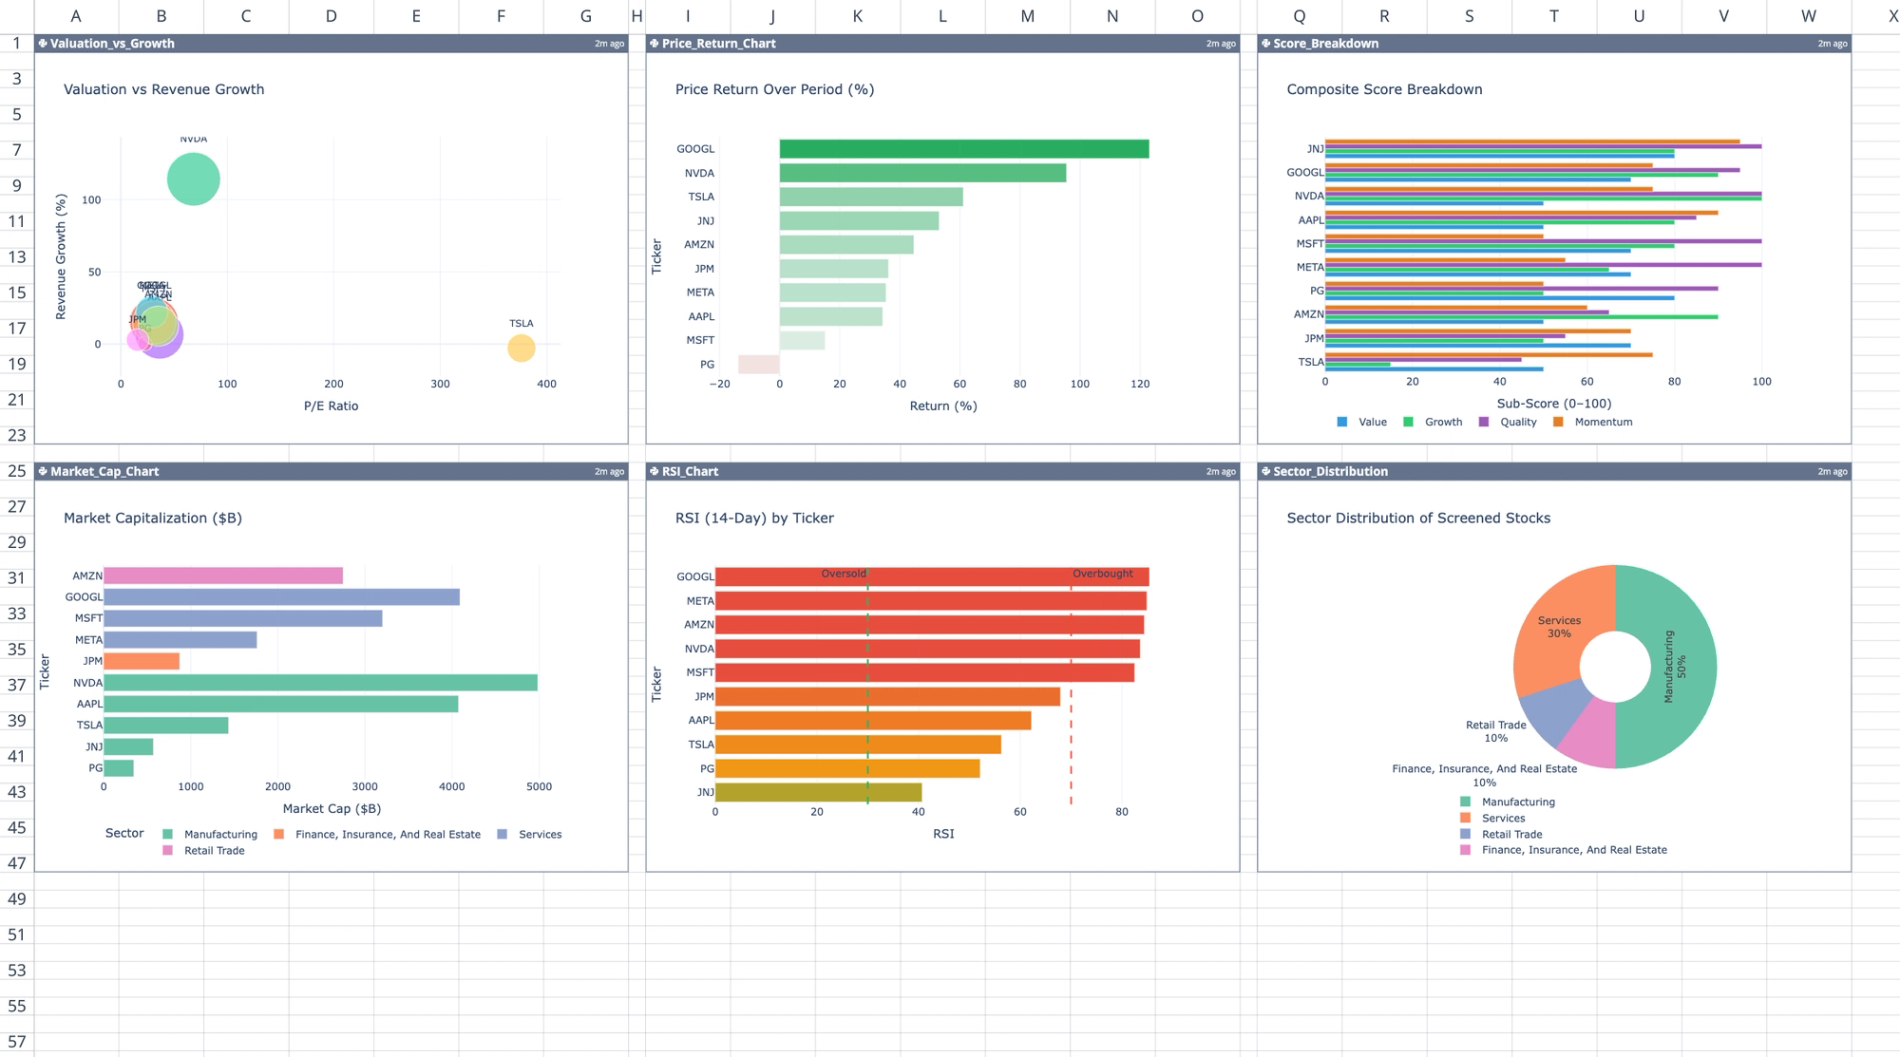
Charts sheet
The Charts sheet contains six independent Plotly chart code cells arranged in a 2x3 grid.
- Displays a bubble scatter plot of P/E versus revenue growth, sized by market cap.
- Includes horizontal bar charts for price returns and market capitalizations, both colored by sector.
- Features a horizontal RSI bar chart with reference lines at 30 and 70.
- Shows a grouped horizontal bar chart decomposing the four sub-scores for each ticker.
- Provides a donut pie chart illustrating sector distribution.
Summary sheet
This sheet executes a Python cell to read the Screener output and input dates. It programmatically generates a single-column text DataFrame summarizing the entire analysis.
- Identifies the top three composite scorers and details their sub-scores.
- Lists stocks passing fundamental screens.
- Flags risks like high volatility, negative free cash flow, and extreme RSI.
- Outputs a sector breakdown and a research-only disclaimer.
How to use this template
To start your analysis, navigate to the Inputs sheet and enter up to ten desired stock ticker symbols. Adjust the start and end dates to define the historical analysis period for the price data.
Next, modify the minimum and maximum thresholds for the thirteen screening criteria as needed. You can also tweak the four composite score weight percentages to prioritize specific investment factors like Value, Growth, Quality, or Momentum. Once your inputs are set, switch to the Screener, Strategies, Charts, and Summary sheets to view the automatically updated data, visualizations, and text reports.
Who this stock screener template is for
This template is designed for financial analysts needing a customizable, code-backed alternative to a standard stock screener excel template. It is also highly useful for retail investors looking to evaluate small portfolios against specific fundamental and technical thresholds. Additionally, data-driven traders can use this tool to visualize composite scoring and risk factors across multiple equities simultaneously.
Use Quadratic to screen, analyze, and visualize stock data
- Automate the extraction and analysis of financial data for up to ten custom ticker symbols.
- Calculate technical and fundamental metrics using live market data and historical financial statements.
- Generate weighted composite scores for each stock based on Value, Growth, Quality, and Momentum factors.
- Visualize stock performance, sector distribution, and scoring breakdowns through dynamically generated charts.
- Produce text-based summaries highlighting top performers, passing strategies, and flagged risks.
- Customize screening criteria, historical analysis periods, and composite score weights directly in the Inputs sheet.
Related templates
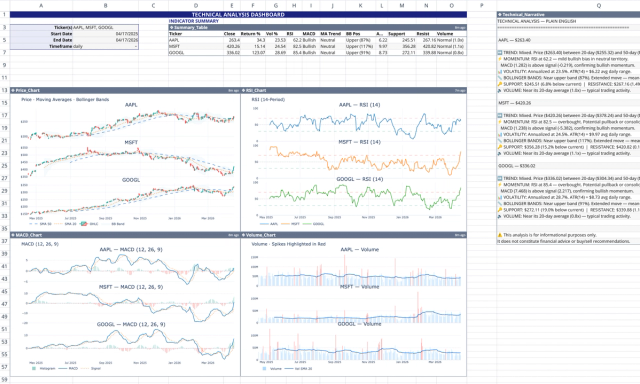
Technical Analysis Template: Live Stock Dashboard
Analyze live market data with technical indicators, narrative, and charts.
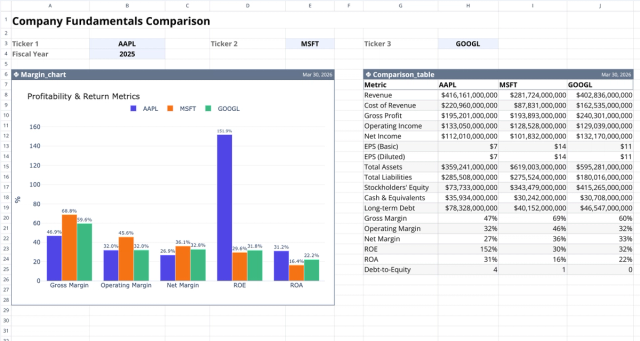
Fundamental Analysis Template: Compare Stocks
Compare fundamental financial metrics and profitability across companies.
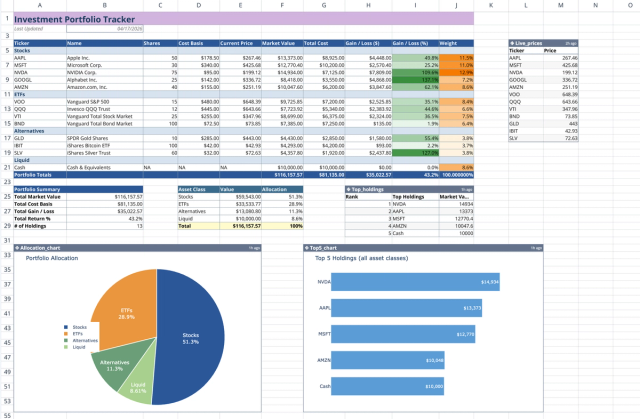
Investment Portfolio Template: Real-time Performance & Charts
Visualize and track your investment portfolio with live data.