
James Amoo, Community Partner
Apr 17, 2026

If you have ever spent hours manually copying and pasting closing prices into a spreadsheet, you already understand how inefficient and error-prone managing stock data in Excel can become. Small mistakes, inconsistent formatting, and missed updates quickly compound, making it difficult to trust your analysis.
This guide walks through how to use native spreadsheet tools to streamline your workflow. This includes organizing clean OHLCV datasets, calculating returns, and building financial data visualization. It also explores how to extend these foundations into coding spreadsheet workflows that reduce manual effort and improve accuracy. The goal is to create a dependable system that supports clear and data-driven decision-making.
The challenge of manual data entry
Traditional spreadsheets like Excel and Google Sheets often suffer from broken links, stale data, and manual refresh errors. Relying on basic data transformation or constantly having to download stock data in Excel via manual CSV exports creates fragile workflows. The moment a financial website changes its formatting, your scraping formulas break.
To build a solid data infrastructure and analytics strategy, you need a reliable way to automatically download stock market data in Excel. Moving away from manual entry ensures your models are always working with the latest numbers.
Another major issue with manual data exploration is the lack of scalability. What works for a basic stock tracking spreadsheet quickly breaks down as your portfolio or watchlist grows. Managing dozens of tickers manually increases the likelihood of missed updates and inconsistent formatting. As complexity increases, the time required to maintain the system grows disproportionately.
There is also the problem of timing and data latency. Manual updates introduce delays between when market data changes and when it is reflected in your tracker. This gap can lead to decisions being made on outdated information, especially during periods of high market volatility. Shifting to automated data updates ensures your system reflects current conditions in near real time.
How to get stock data in Excel
Knowing how to add stock data in Excel natively means you no longer have to rely on clunky workarounds or pieced-together workflows. Microsoft provides built-in tools designed to replace manual entry and serve as a Wisesheets alternative to third-party plugins.
When looking to get stock data in Excel, you generally have two primary methods to choose from. The first is the static Stocks Data Type, which provides a current snapshot of a company. The second is the STOCKHISTORY function, which is designed for time-series analysis and historical tracking.
Enabling the stock data type
For a quick snapshot of current market conditions, you need to know how to enable stock data type in Excel. This feature converts standard text into a rich data entity.
Here is a quick walkthrough on how to add stock data type in Excel:
- Type a company ticker symbol (like MSFT or AAPL) into a cell.
- Select the cell.
- Navigate to the Data tab on the ribbon.
- Click on "Stocks" in the Data Types gallery.
Once converted, the cell will display a small building icon. You can then extract specific properties directly into adjacent cells. By using dot notation (such as =A1.Price or =A1.[52-week high]), you can easily pull current prices, market caps, and daily trading volumes.
This is useful for building lightweight accounting dashboards or quick overviews of your portfolio. Because the data is structured, you can reference it dynamically across your spreadsheet without repeatedly re-entering formulas. It also reduces errors since the values are tied directly to the underlying data type rather than manually typed inputs.
Pulling historical data with STOCKHISTORY
While the data type feature is great for current snapshots, analyzing past performance requires a different approach. The STOCKHISTORY function allows you to download historical stock data in Excel using a simple formula structure.
The basic syntax requires a ticker, a start date, and an end date. You can also specify the interval (daily, weekly, or monthly) and choose which headers to display. For example, =STOCKHISTORY("AAPL", "2023-01-01", "2023-12-31", 1, 1) pulls daily data for Apple over a specific year with headers included.
This function is highly valuable for users who need reliable historical stock data in Excel. It eliminates the need to install and maintain a MarketXLS alternative or third-party Excel stock data add in, keeping your workbook lightweight and native.
In practice, STOCKHISTORY becomes even more powerful when combined with Excel’s built-in analysis tools. You can feed the output directly into charts, pivot tables, or formulas to calculate returns or moving averages. This allows you to build a complete analytical workflow within a single spreadsheet.
Moving beyond basic tracking to charting
Many spreadsheet tutorials stop at creating simple sparklines or basic gain-and-loss columns. However, robust analysis requires dynamic charting with SQL.
You can connect your structured OHLCV data directly to standard line charts to visualize long-term trends. If you want a more detailed view of market volatility for fundamental analysis vs technical analysis, you can map the open, high, low, and close values to a native candlestick chart.
The key to a streamlined workflow is to build templates that automatically update your charts. By linking your charts to dynamic arrays rather than static cell ranges, your visual analysis will immediately reflect the latest price movements whenever your data range changes.
Another important step is improving chart readability so insights are immediately clear. This includes using consistent time intervals, labeling axes properly, and minimizing unnecessary visual clutter. A well-structured chart should allow you to quickly interpret direction and potential turning points without needing to inspect raw data.
It is also useful to standardize different chart types across your tracker. Keeping the same format for all tickers makes comparisons much easier. When every chart follows the same structure, you can scan through multiple assets efficiently and identify patterns or outliers faster.
Common troubleshooting and limitations
Even with automatic Excel formatting, data retrieval can sometimes run into issues. You might occasionally see #VALUE! or #BUSY! errors populate in your grid.
If you encounter errors, start by verifying that the ticker symbol is correct and actively traded. Ambiguous tickers may require an exchange prefix to resolve properly. It is also important to confirm that your internet connection is stable, since these functions depend on external data sources. In some cases, a #BUSY! error simply indicates that the system is still processing your request, so allowing a brief moment for the data to load can resolve the issue without further action.
It is also important to understand inherent limitations. Traditional spreadsheet software relies on delayed data feeds and has strict refresh rate constraints. For standard end-of-day analysis, this is rarely an issue, but it is a factor to keep in mind for time-sensitive trading decisions.
Another common challenge is handling incomplete or missing data points. Certain tickers, especially less liquid assets or recently listed companies, may not return full historical datasets. This can lead to gaps in your analysis or unexpected results in formulas that depend on continuous data. To manage this, it is important to include basic error-handling logic in your spreadsheet, such as fallback values or checks that prevent calculations from breaking when data is unavailable.
Streamlining stock data ingestion in Quadratic
In traditional softwares for stock market analysis, data ingestion is often the weakest link as it involves manual imports, broken formulas, and inconsistent updates. Quadratic eliminates these limitations by automating data ingestion directly into a live and programmable spreadsheet environment.
Direct connections to multiple market data sources
Quadratic enables direct access to historical and live stock market data without requiring external downloads or additional API configuration. Users can simply use AI to pull stock data straight into the spreadsheet, bypassing the fragmented workflows typically associated with Excel-based analysis.
This ensures that all datasets remain synchronized and consistent. Whether you are analyzing a single ticker or a broad universe of stocks, your data remains unified and immediately accessible.
Structured time-series handling
Stock data is inherently sequential, and Quadratic provides a structured environment for managing time-series datasets. This includes maintaining chronological order, handling trading calendars, and ensuring consistent intervals across datasets.
Proper time-series handling is essential for accurate analysis. By enforcing structure at the ingestion stage, Quadratic prevents common issues such as misaligned dates or incomplete sequences.
AI-powered data analysis
Quadratic integrates AI directly into the data workflow, allowing users to clean, structure, and interpret stock data as soon as it enters the system. Instead of manually preparing datasets, you can leverage AI agents for data analysis to normalize formats, detect inconsistencies, and generate analytical logic.
This reduces the time between market research and insight generation. By embedding AI at the earliest stage, Quadratic ensures that your data is not just available but immediately actionable. Let’s see how this works:
First, I use AI to pull stock data for analysis:
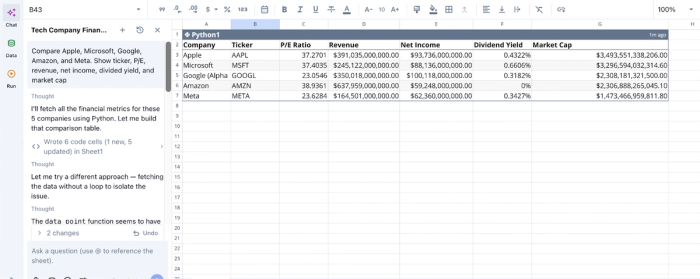
Here, I ask Quadratic AI to act as a financial statements API and “Compare Apple, Microsoft, Google, Amazon, and Meta. Show ticker, P/E, revenue, net income, dividend yield, and market cap.” It pulls real-time stock data for these four companies, instantly ready for analysis. Here:
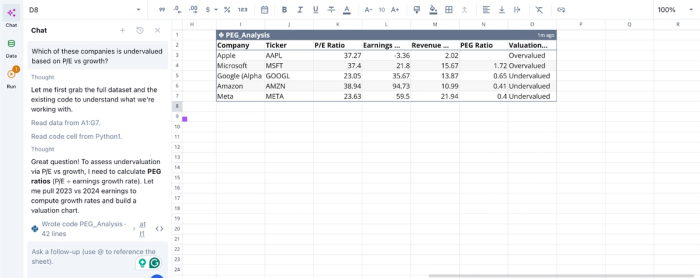
Here, I ask Quadratic AI, “Which of these companies is undervalued based on P/E vs growth?” It instantly generates a table showing the valuation of each company based on the proposed revenue growth and PEG ratio. Quadratic allows technical, non-technical, and citizen developers to generate financial insights from the stock market using text prompts.
AI data visualization for instant feedback
As data is ingested, Quadratic allows you to generate visualizations that reflect the structure and quality of your dataset. Time-series charts, volume trends, and indicator overlays can be created directly from the grid.
These visualizations serve as immediate validation tools. You can quickly confirm whether your data is complete and aligned with expectations before proceeding to deeper analysis. Visualization in Quadratic can also be done by using text prompts. Here:
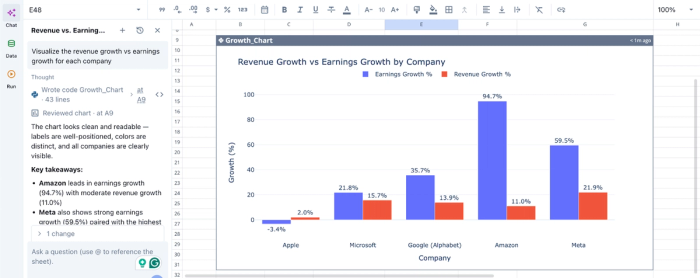
In this image, I ask Quadratic AI to “Visualize the revenue growth vs earnings growth for each company”. In seconds, it generates an interactive bar chart that shows the comparison between revenue growth and earnings growth for all five companies. This capability is especially useful for communicating financial insights to non-technical stakeholders.
Native support for programming languages
Quadratic combines spreadsheet simplicity with the power of Python and SQL, enabling advanced ingestion and data wrangling workflows within a single interface. Users can write scripts to process raw stock data or reshape datasets without leaving the platform.
This removes the need for separate scripting environments. It allows you to handle everything from ingestion to modeling in one place.
Collaboration
Quadratic supports real-time collaboration, allowing teams to work together on data ingestion logic and downstream analysis. Everyone operates within the same environment, ensuring alignment on data sources and transformations.
This collaborative analytics platform reduces miscommunication and ensures that ingestion processes are transparent. Stakeholders can review and validate how data enters the system, building trust in the overall workflow.
Conclusion
Transitioning from manual methods of managing stock data in Excel to automated data pulls fundamentally improves how you track and interpret market performance. Instead of reacting to outdated or incomplete information, you operate with a system that continuously reflects current conditions.
Taking this a step further, building your stock data spreadsheet in Quadratic allows you to unify data ingestion, analysis, and visualization in a single environment. Rather than relying on exports or disconnected tools, your models and charts update automatically as new data arrives. Try Quadratic for free.
Frequently asked questions (FAQs)
How can I get stock data in Excel without manual entry?
You can get stock data in Excel using built-in functions like the Stocks Data Type for current information or the STOCKHISTORY function for historical records. These native tools allow you to automatically download stock data in Excel, creating a structured and repeatable foundation for your analysis. This approach helps avoid the fragility of manual CSV exports or basic web scraping.
What is the difference between Excel's Stocks Data Type and the STOCKHISTORY function?
The Stocks Data Type provides a current snapshot of a company's information, converting a ticker symbol into a rich data entity from which you can extract various real-time properties. Conversely, the STOCKHISTORY function is specifically designed to retrieve historical data of stocks in Excel over a specified period, making it ideal for time-series analysis and tracking past performance.
How does Quadratic help streamline the process of getting historical stock data in Excel?
Quadratic offers a modern workspace with its own built-in STOCKHISTORY function that directly pulls historical OHLCV data into the grid, removing the need for an Excel stock data add-in. Beyond this, Quadratic supports native Python and AI capabilities, enabling users to extend their analysis with custom technical indicators or fundamental data directly within the same unified environment. This simplifies how you download stock market data in Excel and manage complex financial workflows.