
James Amoo, Community Partner
Apr 30, 2026

Table of contents
- MarketXLS for stock market analysis
- Why analysts are seeking alternatives to MarketXLS
- The bottlenecks of traditional financial add-ins
- Quadratic: AI-powered tool for stock market analysis
- MarketXLS vs Quadratic for stock market analysis
- Conclusion: modernize your financial analysis
- Frequently asked questions (FAQs)
For finance teams, investors, and data analysts, the ability to rapidly pull and conduct stock market analysis is critical. While legacy spreadsheet plugins have served this purpose for years, the demands of modern financial data analytics are increasing. Today, professionals require an integrated environment that supports stock tracking, automation, and real-time collaboration.
If you’re evaluating whether to continue using tools like MarketXLS, searching for a Wisesheets alternative, or switching to a more advanced solution, the answer largely depends on the scale and sophistication of your workflows. For lightweight, Excel-based tasks, traditional add-ins may still suffice. However, for automated pipelines and collaborative reporting, platforms like Quadratic stand out as a more capable alternative. As a Python alternative to Excel, Quadratic combines the familiarity of spreadsheets with the power of Python, AI-driven analysis, and scalable data infrastructure.
In this blog post, we’ll break down where MarketXLS performs well, examine the key limitations of traditional financial add-ins, and explain why many teams are actively exploring a MarketXLS alternative. We’ll also show how Quadratic addresses these gaps with a more scalable approach to modern financial reporting and workflows.
MarketXLS for stock market analysis
MarketXLS is a Microsoft Excel add-in designed to bring financial market data directly into spreadsheets, allowing analysts to work within a familiar interface while accessing external data sources without an Excel connect to SQL Server setup. Instead of exporting data from separate platforms, users can call predefined Excel functions to retrieve stock quotes in Excel and macroeconomic indicators in real time.
One of the key strengths of MarketXLS lies in its extensive library of built-in functions and templates. For example, an equity analyst can use MarketXLS functions to import historical price data for a stock and build valuation models without leaving Excel. Similarly, a portfolio manager might track multiple tickers in a single sheet, automatically refreshing live prices and key metrics to monitor performance throughout the trading day.
Why analysts are seeking alternatives to MarketXLS
In almost any retrospective MarketXLS review, users highlight the initial appeal of traditional add-ins. For a long time, these tools offered a simple way to pull basic historical stock data directly into a spreadsheet, saving analysts from manual data entry. It was a straightforward solution for a straightforward problem.
However, as financial models grow in complexity and data needs scale, finance teams experience growing frustration. Handling massive datasets through basic plugins often leads to performance bottlenecks and system crashes. Analysts find themselves transitioning from manual raw data handling to requiring robust spreadsheet automation. This shift in requirements is driving the search for a robust MarketXLS alternative that can handle heavy analytical lifting without slowing down the workflow.
Analysts are also reassessing tools like MarketXLS in the context of collaboration and governance. Traditional spreadsheets like Excel and Google Sheets introduce version control issues and limited auditability. As teams grow and models become more business-critical, there is increasing pressure to ensure reproducibility and clear data lineage. MarketXLS, like many Excel add-ins, operates primarily within the confines of individual spreadsheets, which can make it difficult to standardize processes across teams or enforce consistent data governance policies.
That said, MarketXLS continues to shine in scenarios where speed and ease of use are paramount. Its core strength lies in its seamless integration with Microsoft Excel, enabling users to pull financial data directly into familiar spreadsheet environments without requiring programming knowledge. For individual analysts or small teams working on a relatively lightweight stock tracking spreadsheet, MarketXLS remains a practical and efficient solution.
The bottlenecks of traditional financial add-ins
Running heavy data processes in MarketXLS workflows often exposes the structural limitations of traditional spreadsheet environments. These tools are ultimately constrained by the memory ceiling and single-threaded tendencies of spreadsheet software, which were not designed for large-scale financial modeling. As datasets grow in size and complexity, analysts begin to encounter calculation delays and outright system instability.
Relying on traditional add-ins also introduces meaningful operational risk. Large financial datasets can easily overwhelm spreadsheets, leading to freezes or crashes that interrupt workflows and reduce productivity. At the same time, the dependence on manual inputs and fragile cell-based references increases the likelihood of errors.
To address these limitations, modern platforms like Quadratic offer a more robust approach to financial analysis and stock screening. By combining spreadsheet-like usability with scalable data processing, API-driven data ingestion, and built-in automation, Quadratic eliminates the need to juggle multiple tools while significantly improving performance and reliability.
Quadratic: AI-powered tool for stock market analysis
When evaluating alternatives to MarketXLS, the real question is not just about accessing data, but about building a complete and auditable research workflow. Quadratic is designed around this exact need. Instead of acting as a static Excel add-in, it provides a spreadsheet environment where you can conduct fundamental analysis, technical analysis, portfolio tracking, and screening. Let’s explore the features of Quadratic in detail.
Build dynamic stock research reports with live data
Quadratic allows you to pull financial statements and stock market data directly into the grid from APIs and databases. This eliminates the need for manual exports or static data snapshots, supporting various financial API use cases.
You can structure full research reports that automatically update as new earnings data or price movements occur. By integrating with yfinance alternatives and other live feeds, this ensures your analysis is always based on the most current information available.
Ask AI for stock analysis and research
Instead of manually calculating metrics or relying on a black-box AI stock picker, you can prompt Quadratic’s AI to analyze a company’s financial health, margins, valuation multiples, and other key indicators across multiple companies.
This accelerates fundamental and technical analysis. What would typically require multiple formulas and data sources can now be done in seconds, allowing you to focus on interpreting results rather than assembling them. Let’s see how this works using Quadratic’s stock research template:
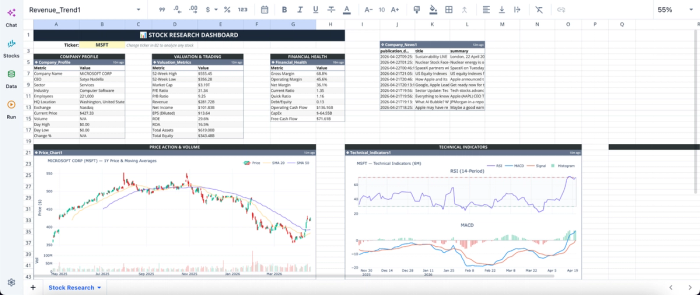
This template provides insights into a company’s live pricing, historical financials, technical indicators, and recent news. You simply have to input the company’s ticker, and the data updates across the board. Quadratic also allows users to add new metrics or ask questions not provided in the template. Here:
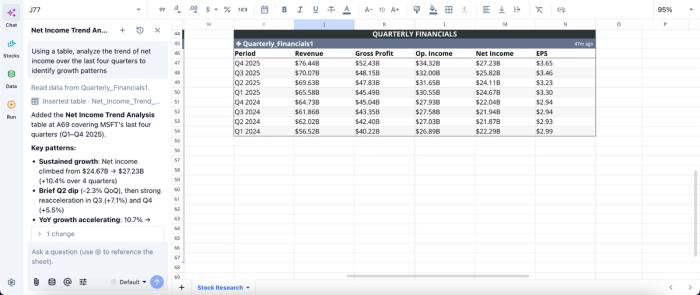
In this image, I ask Quadratic AI to “Using a table, analyze the trend of net income over the last four quarters to identify growth patterns”. It instantly generates a table that gives insights into the gross profit, net income, and EPS for each quarter. This allows non-technical users to perform advanced stock market analysis by simply using text prompts.
Visualize price action and technical indicators instantly
Quadratic enables you to generate charts for price trends, moving averages, and volume analysis directly from live data. These visualizations update automatically as new market data flows in.
This makes it easy to monitor momentum and integrate technical signals into your broader investment strategy without relying on separate Python visualization libraries. Let’s see how this works:
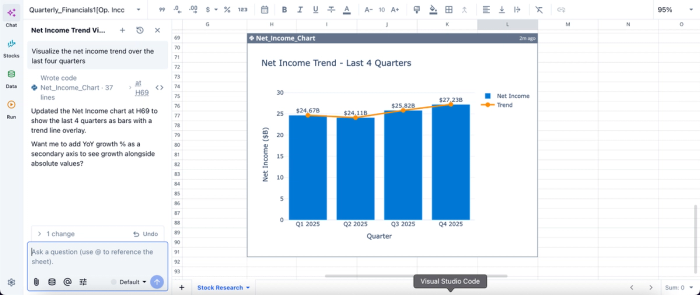
In this image, I ask Quadratic AI to “Visualize the net income trend over the last four quarters.” In seconds, it generates an interactive chart based on the text prompt. This allows easy communication of stock data insights to non-technical stakeholders.
Build a custom stock screener with Python and formulas
Quadratic allows you to create a stock screener with Python, SQL, and spreadsheet logic. Using a stock screener API, you can define your own criteria, such as valuation thresholds, growth rates, or technical conditions.
Unlike rigid prebuilt screeners, this approach gives you complete control over your filtering logic. You can iterate quickly and adapt your screener as market conditions change.
Automated data refresh and scheduled analysis
Quadratic allows you to schedule tasks and run analyses automatically in the background. Your research models and dashboards stay current without manual intervention.
This ensures that your insights are always based on the latest data, supporting faster and more reliable decision-making.
Collaborative investment research workflows
Quadratic is built for real-time collaboration, allowing multiple users to work on the same analysis simultaneously. Teams can review models, validate assumptions, and refine insights together.
This is particularly valuable for investment teams that need a collaborative analytics platform to maintain alignment and ensure consistency across research outputs.
MarketXLS vs Quadratic for stock market analysis
In this section, we’ll see how MarketXLS and Quadratic compare using various metrics, helping you choose the best workflow for stock market analysis.
| Metric | MarketXLS | Quadratic |
|---|---|---|
| Workflow coverage | Primarily data retrieval + Excel-based analysis (plugin model) | Full workflow: data ingestion, analysis (Python/AI), visualization, dashboards in one tool |
| Data integration across sources | Limited to supported datasets within the plugin ecosystem | Combine market data, financials, and APIs seamlessly |
| AI-assisted stock research | Limited AI support, mainly function suggestions rather than full research workflows | AI can compare companies, generate valuation models, and summarize insights across a watchlist |
| Financial statement analysis | Access to financial data, but analysis must be built manually in Excel | Pull, structure, and analyze income statement, balance sheet, and cash flow data with Python/SQL |
| Custom stock screeners | Predefined or formula-based screening with limited flexibility | Fully customizable screeners using Python, SQL, and formulas with dynamic criteria |
| Technical analysis capabilities | Basic support via Excel formulas; requires manual setup and maintenance | Build indicators (moving averages, RSI, etc.) programmatically and visualize instantly |
| Visualization & charting | Standard Excel charts with manual configuration | Dynamic, auto-updating charts integrated with analysis workflows |
| Collaboration | File-based sharing with version conflicts and duplication risks | Real-time multiplayer collaboration with a single source of truth |
Conclusion: modernize your financial analysis
MarketXLS is effective for quick access to financial data within Excel, especially for users comfortable building everything manually from scratch or using SQL in Excel. However, its capabilities largely stop at data retrieval, leaving analysis and reporting fragmented across spreadsheets.
Quadratic, an AI-powered MarketXLS alternative, is designed for modern and AI-assisted investment workflows. It integrates data ingestion, analysis, and visualization into a single system. This enables investors to seamlessly build custom screeners, automate a Python stock tracker, and generate research insights without relying on brittle Excel setups.
For investors who want to move beyond static spreadsheets and build scalable and intelligent stock analysis workflows, Quadratic is the more robust alternative. Try Quadratic for free.
Frequently asked questions (FAQs)
Why are finance professionals seeking a MarketXLS alternative?
Finance professionals are looking for a MarketXLS alternative because traditional add-ins like MarketXLS struggle with the demands of modern financial data analytics. They often face performance bottlenecks and a need for more automated workflows beyond basic data feeds.
What are the main limitations of traditional add-ins like MarketXLS Excel workflows?
Traditional add-ins like MarketXLS Excel workflows are often limited by the underlying spreadsheet's memory and processing power, leading to performance issues and crashes with large datasets. They also introduce data integrity risks due to manual processes and create disjointed workflows that slow down analysis.
How does Quadratic provide a superior alternative to MarketXLS competitors?
Quadratic modernizes financial analysis by integrating native Python, SQL, and traditional formulas within a familiar spreadsheet grid, surpassing the capabilities of many MarketXLS competitors. It uses built-in AI to automate data retrieval and analysis, allowing for comprehensive market data modeling and real-time collaboration in a unified environment.
Are there effective MarketXLS free alternative options for advanced analysis?
While open-source Python libraries can serve as a powerful MarketXLS free alternative for advanced analysis, they often present integration challenges. Modern platforms aim to bridge this gap by bringing the power of these libraries directly into the spreadsheet, unifying coding and traditional financial modeling.