
James Amoo, Community Partner
May 19, 2026

Navigating the financial markets requires the right set of tools, but there is often confusion between real-time stock market analysis and strategic stock filtering. Many retail traders and investors use the terms interchangeably, leading to misaligned expectations and reactive trading habits. Understanding the nuances between a stock scanner vs screener is the first step toward building a more deliberate approach to the markets.
While scanners are incredibly useful for generating real-time alerts, a custom-built screener is the true foundation for repeatable research and data analysis. Relying on alerts alone can lead to chasing price action, whereas a solid data infrastructure and analytics strategy helps you identify high-quality setups before the market even opens.
This article will break down the functional differences between these two essential tools. We will explore how to design effective screening criteria, manage a structured watchlist workflow, and ultimately build a transparent research environment that removes emotional bias from your investment portfolio spreadsheet.
What is a stock scanner?
A stock scanner is a real-time monitoring tool designed to alert active traders to immediate market movements. It constantly sifts through live market data to find equities that meet highly specific conditions.
Scanners track tick-by-tick price action and intraday technical breakouts exactly as they happen. If a stock suddenly surges in volume or crosses above its daily high, a scanner will immediately flag it. This makes scanners an essential tool for day traders who need to capitalize on fleeting momentum.
While scanners are indispensable for intraday execution, relying solely on them without optimizing your data analytics strategy can lead to reactive trading. If you do not have a broader thesis or a pre-vetted list of target stocks, reacting to scanner alerts can quickly result in overtrading and emotional decision-making.
What is a stock screener?
A stock screener is an analytical tool used to filter thousands of equities based on pre-defined fundamental and technical criteria. Instead of streaming live alerts, a screener sifts through massive datasets to find companies that match your exact investment profile. This often involves the need to download historical stock data to power the analysis.
Screeners play a critical role in facilitating repeatable strategic research for investors and swing traders. By allowing you to sort the market by metrics like revenue growth or long-term moving averages, screeners help you uncover opportunities that align with your broader thesis.
When looking at a stock screener vs scanner, the screener acts as a deliberate filter rather than an urgent alarm. It enforces disciplined decision-making by forcing you to define what a "good" setup looks like before you ever place a trade. This process of tracking stock removes emotional bias from your research, preventing the temptation to jump into a stock simply because its price is moving rapidly.
The limitations of "off-the-shelf" commercial tools
Building an effective screener starts with defining a specific investment strategy. Whether you lean toward value, growth, or momentum investing, your criteria must reflect the specific characteristics of the companies you want to own or trade.
Pre-built commercial screeners are convenient (as noted in any MarketXLS review), but they often lack transparency. Many of these platforms act as "black boxes," hiding the custom math and logic behind their proprietary rankings. If a stock drops off your screener, it can be difficult to audit exactly which metric caused the change. Furthermore, you are usually limited to the specific ratios and technical indicators the platform has chosen to include.
Quadratic offers a more balanced approach by combining flexibility with transparency. Instead of being restricted to predefined metrics or forced to build everything from scratch to create a stock screener with Python, you can define your own screening logic, integrate live financial data, and inspect every calculation within a single environment. This removes the need for heavy backend engineering while still giving you full control over your investment model.
Stock Scanner vs Screener: Key Functional Differences
Understanding the distinction between a stock scanner vs screener comes down to how and why you use the data. While both tools filter the market, they serve entirely different phases of the trading lifecycle.
Time horizons
Stock scanners are designed for intraday use, focusing on real-time alerts and short-term opportunities. They continuously monitor live price action and surface stocks experiencing unusual activity within minutes or even seconds. This makes them ideal for day traders and momentum-based strategies that depend on timing precision.
Stock screeners, in contrast, operate on longer time horizons. They are typically used for end-of-day or periodic financial data analysis to identify investment opportunities based on well-defined criteria. Instead of reacting to immediate market moves, screeners help investors plan trades over days, weeks, or even months by identifying fundamentally strong or undervalued assets.
Underlying data
Scanners rely heavily on real-time data feeds, including price, volume, bid-ask spreads, and sometimes short-term technical indicators. Their effectiveness depends on speed and accuracy, as even slight delays can reduce the value of the signals they generate. This narrow but high-frequency dataset is optimized for detecting immediate market behavior.
Screeners, on the other hand, draw from a much broader and deeper dataset. They incorporate financial statements, historical performance metrics, and long-term technical indicators. This allows investors to evaluate companies holistically, focusing on fundamentals and sustained trends rather than short-lived price fluctuations.
User intent
The primary goal of a stock scanner is to answer the urgent question: “What is moving right now?” It is built for rapid decision-making, helping traders identify entry and exit points in fast-moving markets. The emphasis is on immediacy and capturing short-term inefficiencies.
A stock screener answers a more strategic question: “What fits my investment criteria?” It is used to build a curated list of potential investments based on predefined filters such as growth metrics, valuation thresholds, or sector focus. The intent is not immediate execution, but informed selection and portfolio construction.
Signal frequency and noise levels
Stock scanners generate a high volume of signals throughout the trading day. Because they are tuned to detect short-term movements, they can produce frequent alerts, many of which may be false positives or driven by temporary volatility. Traders must quickly interpret and filter these signals to avoid reacting to market noise.
Stock screeners produce far fewer signals, but those outputs are typically more stable and meaningful. Since they rely on lower-frequency data, the results are less prone to short-term noise. This makes screeners better suited for disciplined analysis, where quality and consistency of signals matter more than speed.
Workflow integration and usage patterns
Scanners are often embedded directly into active trading workflows. They run continuously in the background, feeding alerts into trading platforms where decisions are executed immediately. Their role is tightly coupled with execution, making them a core tool for real-time market participation.
Screeners are usually part of a broader research workflow. Investors use them to periodically refine watchlists and identify new opportunities. Rather than driving immediate trades, screeners support deeper analysis and long-term decision-making, often serving as the starting point for further research.
Building a transparent screener in Quadratic
Quadratic provides the ideal middle ground for building a custom screener. It offers a modern spreadsheet environment powered by AI-assisted Python, allowing you to create sophisticated analysis workflows without needing a finance background.
Pull multi-source market data directly into your screener
A robust stock screener starts with high-quality data. Quadratic allows you to connect directly to multiple live stock market data sources (like Alpha Vantage vs Finnhub) without leaving the spreadsheet environment. You can ingest price data, fundamentals, financial statements, a stock screener API, and even alternative datasets into a single grid.
This eliminates the fragmentation common in traditional workflows, where analysts struggle to connect spreadsheets in Excel, juggle CSV exports, API scripts, and separate BI tools. Instead, your entire screening universe updates automatically, ensuring your candidate list always reflects the most current market conditions.
Automate screening workflows and refresh cycles
A screener is only valuable if it stays current. Quadratic allows you to schedule data updates and model recalculations to run automatically in the background.
This means your watchlists, rankings, and dashboards are always up to date without manual intervention. Instead of rebuilding screens or refreshing datasets, you can focus on interpreting results and making investment decisions.
Build custom screening logic with Python, SQL, and formulas
Rather than relying on pre-defined filters, Quadratic enables you to construct a fully custom screener using native Python, SQL, and spreadsheet formulas. You can define your own ranking models, whether that involves multi-factor scoring or blended fundamental metrics.
For example, you can leverage Python and SQL to calculate composite scores that combine revenue growth, margin expansion, and momentum indicators, all within the same environment. This flexibility transforms your screener from a static filter into a dynamic research engine tailored to your strategy.
Use AI to accelerate factor discovery and model iteration
Developing and refining screening criteria can be time-intensive. Quadratic’s AI capabilities streamline this process by helping you generate, test, and iterate on screening logic directly in the grid.
You can prompt the system to compare factor importance across your universe or suggest improvements to your ranking model. This reduces the friction of experimentation while keeping all assumptions visible and editable.
Let’s see how this works using the stock screener template in Quadratic:
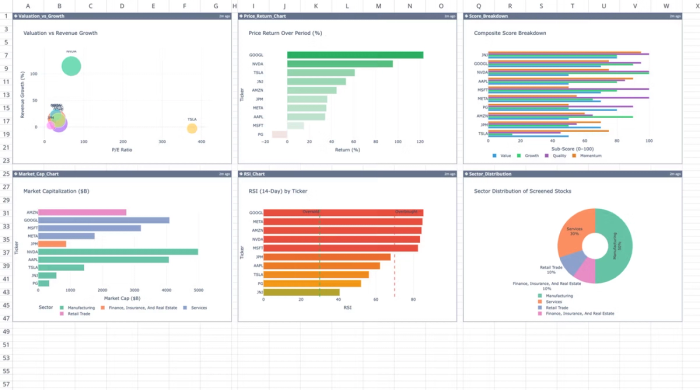
This template automates the extraction and analysis of financial data for up to ten custom ticker symbols. It calculates technical and fundamental metrics using live market data and historical financial statements directly within Quadratic. Users can also perform custom analysis using simple text prompts:
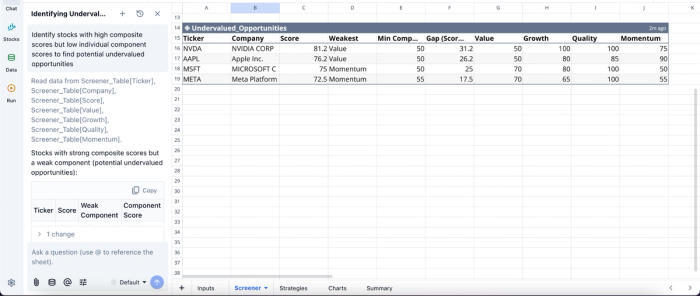
In this image, I ask Quadratic AI to “Identify stocks with high composite scores but low individual component scores to find potential undervalued opportunities”. It generates a table that shows the the undervalued opportunities across all the tickers.
Visualize screening outputs and market trends in real time
Once your screener produces results, interpretation becomes critical. Quadratic enables you to build dynamic financial data visualizations directly on top of your screening outputs.
You can chart factor distributions or visualize the relationship between your scoring model and actual performance. Because these charts are tied to live data, they update automatically as market conditions change. Visualization in Quadratic can also be done using text prompts:
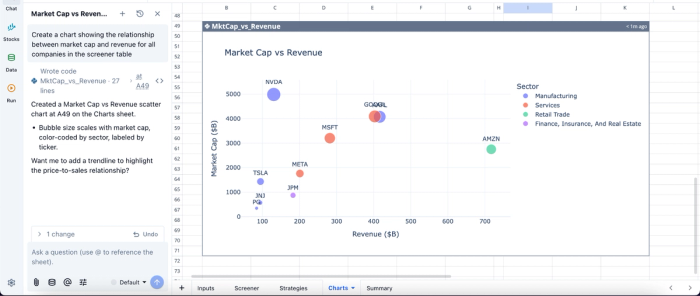
In this image, I ask Quadratic AI to “Create a chart showing the relationship between market cap and revenue for all companies in the screener table”. It creates a market vs revenue relationship chart for each screener in my data.
Collaborate on screening models in real time
Stock screening is rarely a solo activity in professional environments. Quadratic’s multiplayer workspace allows analysts, portfolio managers, and researchers to collaborate on the same screener simultaneously.
Teams can review logic, adjust parameters, and validate outputs together without version control issues. This shared environment ensures that your screening framework evolves collectively, rather than becoming siloed across individuals or departments.
Conclusion
The market requires both speed and strategy in evaluating stock scanner vs screener, but they serve different purposes. Scanners are built for immediate alerts, helping active traders pinpoint exact entry and exit moments. However, custom screeners are the true bedrock of strategic investing. They allow you to filter out the noise and focus only on equities that meet your pre-defined standards.
Having a transparent environment to design your criteria and refine your strategies is essential for removing emotional bias from your process. When you control the logic behind your research, you trade with greater confidence and discipline.
By combining AI, code, and spreadsheet formulas within a single environment, Quadratic allows you to build a custom stock screener where your criteria, calculations, and rankings are fully visible. Try Quadratic for free.
Frequently asked questions (FAQs)
When should I use a stock screener vs scanner in my trading workflow?
You should use a stock screener for strategic, end-of-day, or long-term analysis to build a foundational watchlist of stocks that fit your investment profile. A stock scanner is best utilized for intraday trading to pinpoint exact entry and exit moments, capturing immediate momentum from your pre-vetted watchlist. Understanding this distinction helps in disciplined decision-making.
How does Quadratic assist in building a transparent stock screener?
Quadratic provides an AI-powered spreadsheet environment where users can connect to diverse market data and financial APIs, like yfinance, directly within a familiar interface. It allows for the creation of custom screening criteria and proprietary metrics using AI-assisted Python and yfinance alternatives, ensuring every calculation and piece of logic is fully visible and auditable. This approach offers complete transparency, unlike rigid "black-box" commercial tools.
Why is a transparent stock screener important for investors?
A transparent stock screener is crucial because it allows investors to fully understand and audit the exact logic and criteria behind their filtered results. Without transparency, it's difficult to identify why a stock made a list or to adapt the screening process to changing market conditions. This clarity helps remove emotional bias and builds confidence in your research workflow.