
James Amoo, Community Partner
May 7, 2026

The interest in applying machine learning to financial data analytics has surged among analysts and data practitioners. However, machine learning for stock selection is not a speculative oracle or a shortcut to guaranteed alpha. A successful application requires treating the process as an auditable research endeavor that prioritizes robust methodology and data exploration.
In this article, you will learn how to reframe the problem of financial modeling, avoid common pitfalls, and build a reliable evaluation workflow that turns a stock selection algorithm into a practical analytical tool.
Reframing the problem: Research over prediction
Many data practitioners start by trying to predict raw asset prices. This approach is notoriously flawed because price series are non-stationary and highly noisy. A more effective financial ML methodology focuses on predicting returns or directional probabilities, a key aspect of financial forecasting.
By framing machine learning stock selection as a rigorous research problem, you set realistic expectations for your models. Successful predictive modeling relies on hypothesis-driven research rather than throwing algorithms at massive datasets and hoping to find patterns. The ultimate goal is to build a reliable analytical framework instead of a black-box prediction engine that cannot be explained or trusted.
This shift in mindset also encourages better feature engineering and data integration techniques. Instead of chasing short-term price movements, you begin to focus on economically meaningful signals and test them across different market regimes. Incorporating robust backtesting and clear performance metrics ensures that your models are not just statistically sound but also practically useful in real-world decision-making.
Why financial ML for stock selection fails
Financial markets are incredibly complex, and machine learning models are highly susceptible to hidden vulnerabilities. One of the most common errors is data leakage. This occurs when information from outside the training dataset is used to create the model. A specific form of this is look-ahead bias, where future data accidentally slips into the training set, resulting in falsely optimistic models that fail in live stock screening.
Another major risk is overfitting. Financial data is full of historical noise, and complex algorithms can easily memorize this noise instead of learning underlying patterns. Finally, practitioners must account for concept drift. Markets constantly experience changing regimes. A model trained on past data during a low-volatility bull market may suddenly fail when new economic conditions arise.
A further challenge lies in poor feature selection and weak economic grounding. Many models rely on purely statistical relationships without considering whether those relationships make sense in a financial reporting context. This often leads to fragile signals that degrade quickly when market conditions change. Without a strong hypothesis or economic rationale behind the features, even models that perform well in backtests can fail to generalize in live environments.
Additionally, transaction costs and market frictions are frequently underestimated or ignored altogether. Slippage, bid-ask spreads, and execution delays can significantly erode theoretical returns generated by a model. A strategy that appears profitable on paper may become unviable once real-world trading constraints are applied. This disconnect between simulated performance and actual execution is a critical reason why many financial ML models fail outside of controlled testing environments.
Building a machine learning framework for stock selection
Executing machine learning research and data analysis requires a step-by-step methodology. Rather than treating model creation as a one-off coding task, you should frame it as a continuous loop of exploration, testing, and validation.
1. Data preparation and feature engineering
Proper financial data processing is the foundation of any reliable model. Financial time series data requires specific treatments before you can feed it into an algorithm. One critical concept is stationarity. Transforming raw price series into stationary formats, such as log returns, is essential for model stability.
Once the data is stationary, you can begin feature engineering. This process demands disciplined feature selection. Adding too many irrelevant or highly correlated variables will bloat the model and increase the risk of overfitting.
Quadratic streamlines this process by combining built-in access to live and historical stock market data with native Python execution directly in the grid. You can pull price series, transform them into stationary formats, and engineer features in the same workspace without exporting data to external notebooks. This ensures that your feature pipeline remains transparent and easy to iterate on.
2. Establishing baselines for honest comparison
Every complex machine learning model needs a reality check. You must compare your advanced algorithmic stock selection against naive baseline models, such as a simple buy-and-hold strategy or a basic linear regression.
These baselines provide a necessary benchmark to ensure that the added complexity of machine learning is actually contributing analytical value. Structuring your evaluation metrics to compare against these simple models promotes honest evaluation and prioritizes robust methodology over sheer predictive accuracy.
Within Quadratic, you can build and track these baseline strategies alongside your more advanced models using the same underlying dataset. Because the data is live and centrally managed, comparisons remain consistent and up to date. You can also leverage AI agents for data analysis to quickly generate benchmark models and evaluate their outputs, making it easier to validate whether your approach delivers meaningful incremental value.
3. Rigorous backtesting and performance metrics
Testing your models on historical data is a critical step, but it must be done carefully to avoid the pitfalls mentioned earlier. When setting up Python backtesting, you need performance metrics that matter to financial practitioners.
Basic accuracy is rarely enough. Instead, use the Sharpe ratio to measure risk-adjusted returns, which helps you understand if the returns justify the volatility. Additionally, calculating the maximum drawdown is vital for understanding worst-case scenarios and potential peak-to-trough losses during a specific period, a process often enhanced by Monte Carlo simulation.
Quadratic enables you to run these backtests directly where your data and features already reside. Using native Python and SQL, you can implement full backtesting logic, compute advanced performance metrics, and simulate different scenarios without leaving the spreadsheet environment. Since all calculations, data inputs, and outputs are visible in one place, your entire validation process remains auditable and easy to refine over time.
Unifying your research workflow in Quadratic
A major problem with traditional machine learning workflows is fragmentation. Logic, data, and evaluation are often scattered across isolated Python scripts and separate spreadsheets.
Quadratic solves this by providing a unified workspace that brings your entire research loop into a single environment. It leverages AI for predictive analytics and intelligent stock market analysis. Let’s explore the features of Quadratic in detail:
Ingest multi-source financial data for richer feature sets
Effective stock selection machine learning models depend on diverse inputs. Price data alone is rarely sufficient; combining it with fundamentals, macro indicators, and alternative datasets leads to more robust signals. Quadratic enables direct connections to multiple data sources, allowing you to ingest live stock market data, financial statements, and external datasets into one cohesive workspace.
This makes it easier to construct feature libraries that capture different dimensions of market behavior. Instead of manually stitching datasets together, you can build a continuously updating data foundation that supports both exploratory analysis and production-grade modeling.
Build and refine custom stock screeners
Machine learning outputs are often most useful when translated into actionable screening criteria. Quadratic allows you to convert model predictions into a dynamic stock portfolio tracker that ranks or filters securities based on your chosen signals.
Because the screener is powered by live data and integrated model logic, it continuously updates without manual intervention. This creates a direct link between your research and execution workflow, ensuring that your insights are immediately actionable.
Engineer predictive features with Python inside the grid
Feature engineering is where most of the predictive power in machine learning models is created. Transformations such as log returns, rolling volatility, factor exposures, and technical indicators require both precision and flexibility. Quadratic integrates native Python, SQL, and JavaScript directly into the spreadsheet, allowing you to implement these data transformations alongside your raw data.
This eliminates the need to export datasets into external environments. You can iterate quickly on feature definitions, validate outputs immediately, and maintain a clear lineage from raw inputs to engineered variables. The result is a disciplined feature pipeline that remains transparent and easy to audit.
Backtest strategies with integrated performance analytics
A machine learning model is only as valuable as its real-world performance. Quadratic allows you to implement backtesting logic directly within the same environment where your data and features reside. This ensures consistency between training data and evaluation outputs.
Using native Python and SQL for data analysis, you can compute practitioner-relevant metrics such as Sharpe ratio, maximum drawdown, and return distributions. These calculations are tied to live data inputs, ensuring your backtests remain current and reflective of evolving market conditions.
Prototype and validate stock models with AI-assisted workflows
Building and comparing models can be time-consuming, especially when testing multiple hypotheses. Quadratic’s AI capabilities accelerate this process by helping you generate model logic, evaluate results, and refine your approach without writing every component from scratch.
Instead of manually wiring up each experiment, you can ask the system to evaluate how different features (such as momentum, volatility, and Sharpe ratio) impact your stock rankings.
Let’s see how this works using Quadratic’s stock market analysis template:
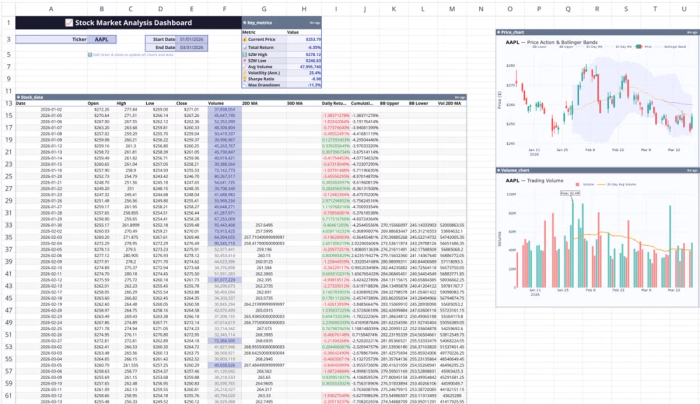
This template includes features for real-time stock data visualization, technical indicator calculations, price trend analysis, and more. All you have to do is input the stock ticker, and your data updates automatically across the board. Users can also perform custom analysis using text prompts. Here:
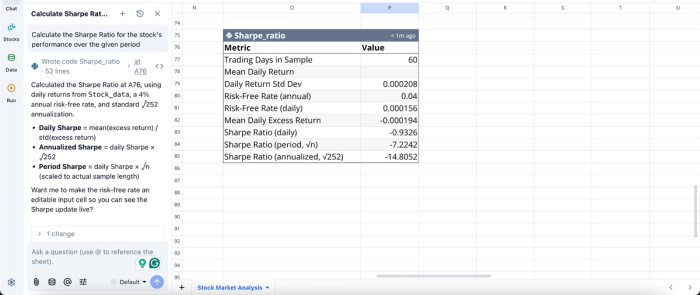
In this image, I ask Quadratic AI to “Calculate the Sharpe Ratio for the stock's performance over the given period.” It instantly generates a table that gives insights into the Sharpe Ratio for different periods.
Visualize model behavior and portfolio impact
Understanding how a model behaves over time is critical for trust and interpretability. Quadratic enables you to create financial data visualizations of predictions, signals, and portfolio performance directly from your model outputs.
These visualizations update automatically as new data flows in, allowing you to monitor how your model responds to changing market conditions. This continuous feedback loop helps you identify instability or degradation in predictive power early.
Visualization in Quadratic can also be done by using text prompts:
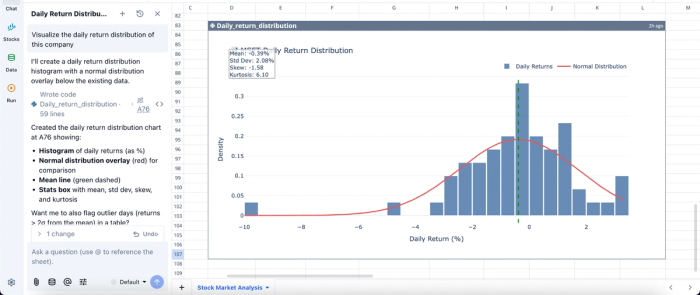
In this image, I ask Quadratic AI to “Visualize the daily return distribution of this company”. It creates a histogram of the daily returns alongside the normal distribution overlay. This helps analysts easily understand the insights generated from raw data.
Collaborate on model development with full transparency
Stock selection by machine learning benefits from peer review and cross-functional input. Quadratic’s real-time collaboration features allow multiple users to work on the same model simultaneously, reviewing assumptions and refining logic together.
This collaborative analytics platform eliminates version control issues and ensures that all stakeholders operate on a single source of truth. It also makes it easier to document decisions and maintain a clear audit trail of model evolution.
Conclusion
Applying machine learning to stock selection is about enforcing discipline. Without a structured workflow, even the most sophisticated models can devolve into unreliable systems that fail under real market conditions. The real edge comes from combining rigorous data preparation and robust validation into a repeatable research process.
When this methodology is paired with the right tooling, machine learning becomes a practical extension of your investment workflow rather than an experimental side project. Quadratic enables you to consolidate data ingestion, feature engineering, modeling, and backtesting into a single environment. Try Quadratic for free.
Frequently asked questions (FAQs)
What is the primary goal of applying machine learning for stock selection?
The main goal of machine learning for stock selection streamline how to select stocks and develop a disciplined research process for predicting returns. This approach sets realistic expectations and focuses on building a reliable analytical framework.
How does Quadratic support a disciplined workflow for machine learning for stock selection?
Quadratic provides a unified workspace that integrates live market data, native Python for feature engineering and backtesting, and spreadsheet visibility. This combination ensures that all model assumptions and outputs are transparent and auditable, making machine learning for stock selection a more reliable process by preventing fragmentation and errors.
Why is rigorous backtesting crucial for machine learning for stock selection?
Rigorous backtesting helps validate models on historical data while carefully avoiding common pitfalls. It involves comparing complex algorithms against naive baselines and using financial performance metrics like the Sharpe ratio and maximum drawdown to assess risk-adjusted returns and worst-case scenarios.