
James Amoo, Community Partner
Apr 30, 2026

Python has become the standard programming language for financial data analysis, and for many, the journey begins with a simple library. However, as your models grow in complexity, you quickly realize that finding robust yfinance alternatives is critical for building dependable data pipelines.
As workflows scale, challenges such as inconsistent data reliability and limited access to real-time or institutional-grade datasets start to surface. What begins as a convenient tool for business data analysis can become a bottleneck when you need production-ready infrastructure and seamless collaboration across teams. This is where more advanced solutions become necessary to ensure stability and efficiency in financial modeling.
Platforms like Quadratic provide a stronger alternative by combining Python and SQL for data analysis with built-in data access and spreadsheet workflows. Instead of stitching together separate tools, users can run end-to-end financial analysis in a single environment. This makes it easier to move from experimentation to production without the usual friction.
yfinance for stock market analysis
yfinance is a popular open-source Python library that allows users to fetch financial market data directly from Yahoo Finance. It provides access to historical price data, dividends, splits, financial statements, and basic company information through a simple Python financial API integration. Unlike traditional APIs, yfinance is lightweight and easy to integrate into data analysis workflows, making it especially appealing for developers and data analysts who prefer working in dedicated data science tools.
yfinance excels in rapid data exploration and prototyping. For example, an analyst can quickly pull historical stock prices for multiple tickers and visualize trends using libraries like pandas and matplotlib. While it may not offer the same level of reliability or official support as enterprise data providers, its simplicity and flexibility make it a go-to tool for early-stage data analysis and transformation.
The breaking point: why analysts outgrow yfinance
The yfinance library is incredibly popular for ad-hoc data exploration. It allows users to pull historical market data into a Pandas dataframe with just a few lines of code. The library relies on unofficial web scraping of Yahoo Finance rather than connecting to a supported API endpoint, carrying inherent risks of screen scraping.
This scraping approach creates immense pipeline fragility and risk of stale data. Analysts frequently encounter sudden rate limits, blocked IP addresses, and completely broken requests when the underlying website structure changes. When your financial models fail right before a critical meeting because of a blocked request, the need for a reliable alternative to yfinance Python becomes painfully clear.
There is also a clear gap between data retrieval and actionable insight. While yfinance simplifies access to raw data, it does not provide built-in tools for advanced data analytics, automation, or visualization. Analysts must rely on a patchwork of additional libraries and custom code to clean and interpret the data. This increases complexity and slows down iteration, reinforcing the need for more integrated platforms that can handle both data access and analysis within a unified environment.
Core criteria for evaluating yfinance Python alternatives
Selecting a true yfinance alternative requires evaluating financial data providers across several critical dimensions. At a minimum, the provider should offer reliable API endpoints with clear documentation and consistent uptime guarantees. Cost must also be assessed in context, especially as usage scales, since pricing structures can vary significantly depending on call volume and access frequency.
In practice, these factors directly impact the viability of your workflows. A provider with poor reliability can introduce silent failures into models, while limited data coverage can restrict the scope of your analysis. Similarly, pricing that seems reasonable at a small scale can quickly become prohibitive as you expand usage across teams or increase the frequency of data requests. Evaluating these criteria holistically ensures that your chosen solution can support both current needs and future growth without requiring constant re-architecture.
Free APIs often appear attractive for initial experimentation, but they frequently come with hidden trade-offs. Strict rate limits, delayed data feeds, and incomplete historical datasets can significantly slow down analysis and reduce confidence in outputs. In contrast, enterprise-grade solutions provide the stability and data depth required for production-level financial modeling, enabling analysts to focus on generating insights rather than working around infrastructure limitations.
Building reliable workflows with Quadratic
Instead of writing scripts and switching between tools, Quadratic enables a continuous analytical loop. You can ingest, transform, analyze, and visualize stock data in one place, making it easier to build repeatable and scalable investment workflows. Let’s explore the features of Quadratic in detail.
Connect to multiple live data pipelines
Quadratic integrates with APIs, databases, and external data providers, allowing you to pull in diverse datasets without manual configuration.
This eliminates the dependency on a single library or data source. Your workflow becomes more resilient and adaptable as you scale.
Create reusable market monitoring dashboards
Quadratic allows you to build dashboards that track key market indicators, sector performance, and individual stock tracking in real time. Data flows directly into the grid from multiple sources and updates automatically.
This transforms passive monitoring into an active system, upgrading your standard stock portfolio tracking spreadsheet. Instead of checking different platforms throughout the day, you have a centralized view that continuously reflects current market conditions.
Blend alternative data with traditional market data
Quadratic makes it easy to combine traditional stock data in Excel or its native grid with alternative datasets such as macroeconomic indicators, sentiment data, or internal metrics. All of this can be analyzed within the same grid.
This broader context allows for more sophisticated investment decisions. You are no longer limited to price and financial reporting alone.
Maintain synchronized multi-asset analysis
Quadratic supports analysis across equities, ETFs, and other asset classes within a single workspace. You can compare performance, correlations, and exposures across different instruments.
This unified view simplifies portfolio-level thinking, much like a well-structured investment portfolio spreadsheet. Instead of analyzing assets in isolation, you can understand how they interact within a broader strategy.
Generate and refine analytical logic with AI
Quadratic’s AI can assist in building formulas, generating Python scripts, and structuring analysis workflows tailored to your needs.
This accelerates development while maintaining control. You can prompt Quadratic’s AI to compare revenue growth, margins, valuation multiples, and other key indicators across multiple companies. Let’s see how this works using the stock screener template in Quadratic:
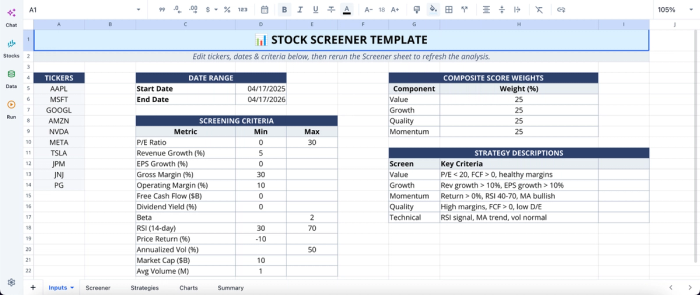
This template automates the extraction and analysis of financial data for up to ten custom ticker symbols. It bridges fundamental analysis vs technical analysis by calculating metrics using live market data and historical financial statements directly within Quadratic. You can edit the input sheet, and the data updates automatically across the screener, strategies, charts, and summary.
Let’s see how we can perform analysis using text prompts:
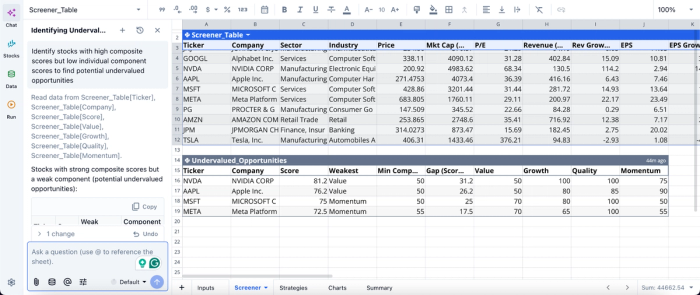
In this image, I ask Quadratic AI to “Identify stocks with high composite scores but low individual component scores to find potential undervalued opportunities.” It generates a table that shows key metrics of undervalued stocks, including the growth value, quality, and momentum. As a powerful MarketXLS alternative, this approach allows non-technical users to perform advanced analysis before making decisions.
Build interactive visual layers for decision-making
Quadratic enables you to create financial data visualization and visual summaries directly from your data. These visuals update automatically as underlying datasets change.
This ensures that insights are always current and easy to interpret. Visualization in Quadratic can also be done by using text prompts:
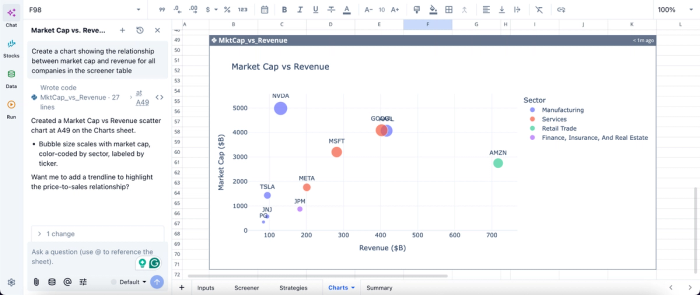
In this image, I ask Quadratic AI, “Create a chart showing the relationship between market cap and revenue for all companies in the screener table.” In seconds, it creates a scatter plot based on my prompt.
Collaborate across research and investment teams
Quadratic’s real-time collaboration allows multiple users to work on the same analysis simultaneously. Teams can review models, validate assumptions, and iterate together.
This reduces friction and ensures alignment. Everyone operates from the same dataset and analytical framework.
Conclusion: graduate to production-grade analytics
Relying on fragile web scraping tools is a risk your financial models cannot afford. Repeatable financial analysis requires software for stock market analysis that guarantees consistency and uptime.
However, choosing yfinance alternatives is only half the battle. The environment where you clean, model, and visualize that data matters just as much. Unifying your pipeline ensures that your insights are built on a foundation of total reproducibility. Quadratic offers a unified spreadsheet environment that allows you to ingest live data, then use AI to analyze and generate interactive visualizations. Try Quadratic for free.
Frequently asked questions (FAQs)
Why should I consider alternatives to yfinance Python?
The yfinance library relies on unofficial web scraping, which leads to pipeline fragility with frequent rate limits, blocked IPs, and broken requests. For production-grade financial models and dependable data workflows, a Python yfinance alternative that uses official API endpoints is essential. This ensures consistent data access and reliability.
What are the key criteria for evaluating yfinance Python alternatives?
When selecting a yfinance Python alternative, prioritize data reliability from official API endpoints with guaranteed uptime and clear documentation. Also, consider data coverage for real-time or historical needs, and evaluate the cost at scale to ensure it meets your long-term production standards.
How does Quadratic enhance workflows after choosing a yfinance alternative?
Quadratic provides a unified workspace for everything from stock analysis to transaction tracking that eliminates workflow fragmentation by integrating native Python, SQL, and formulas within a familiar spreadsheet grid. This allows you to seamlessly connect to your chosen yfinance alternative, then clean and visualize data in one browser-based environment.