Table of contents
- The complexities of multi-unit ice cream finance
- Why traditional spreadsheets and rigid software fall short
- Step-by-step: building a multi-unit P&L in Quadratic
- Analyzing unit economics and contribution margins
- Conclusion: agile accounting for sweet success
- Use Quadratic to Master Multi-Unit P&L and Cost Allocation
Scaling an ice cream brand from a single beloved shop to a multi-unit operation introduces massive operational complexity. When your footprint expands to include multiple retail parlors, pop-up events, and a central production factory, the financial logistics change completely. T
racking high-level revenue might still be straightforward, but accurately attributing shared costs, mapping messy point-of-sale data, and understanding true unit-level profitability becomes incredibly difficult. Mastering ice cream economics requires more than just looking at the top line. This article provides a step-by-step guide to building a monthly multi-unit profit and loss statement and cash flow statement that bridges the gap between raw bank data and actionable financial insights.
The complexities of multi-unit ice cream finance
Multi-entity restaurant and hospitality accounting requires a fundamentally different approach than single-unit bookkeeping. While a single shop allows you to look at total revenue versus total expenses, a growing brand requires segment reporting to truly understand what is driving profit. You are no longer running identical shops. Instead, you are balancing distinct operating units with different margin profiles, such as retail parlors, catering events, and a central manufacturing facility.
This shift makes ice cream finance inherently complex. Financial controllers often face absolute data chaos when trying to reconcile these different arms of the business. You have to deal with incomplete or truncated sales data from various point-of-sale systems alongside a massive volume of bank transactions spanning labor, rent, utilities, suppliers, and administrative expenses.
Why traditional spreadsheets and rigid software fall short
When trying to solve these data challenges, operators usually find themselves stuck between two extremes. On one side are traditional spreadsheets. While familiar, they are highly prone to manual errors, duplicate entries, and broken formulas when dealing with thousands of bank imports each month.
On the other side is rigid financial planning and analysis software. These platforms are often prohibitively expensive and operate as a black box, making it difficult to customize unique shared-cost rules. For example, splitting a single factory electricity bill across retail production and event catering can be nearly impossible in inflexible software.
The solution lies in a flexible data environment like Quadratic. Quadratic combines the familiar grid of a modern spreadsheet with the power of native Python, SQL, and advanced formulas. This allows finance teams to automate data ingestion and build custom allocation rules without losing transparent control over their numbers.
Step-by-step: building a multi-unit P&L in Quadratic
Creating a reliable monthly reporting cadence requires a workspace that can handle messy data and complex logic simultaneously. Here is how a multi-unit operator can build a comprehensive profit and loss statement using Quadratic.
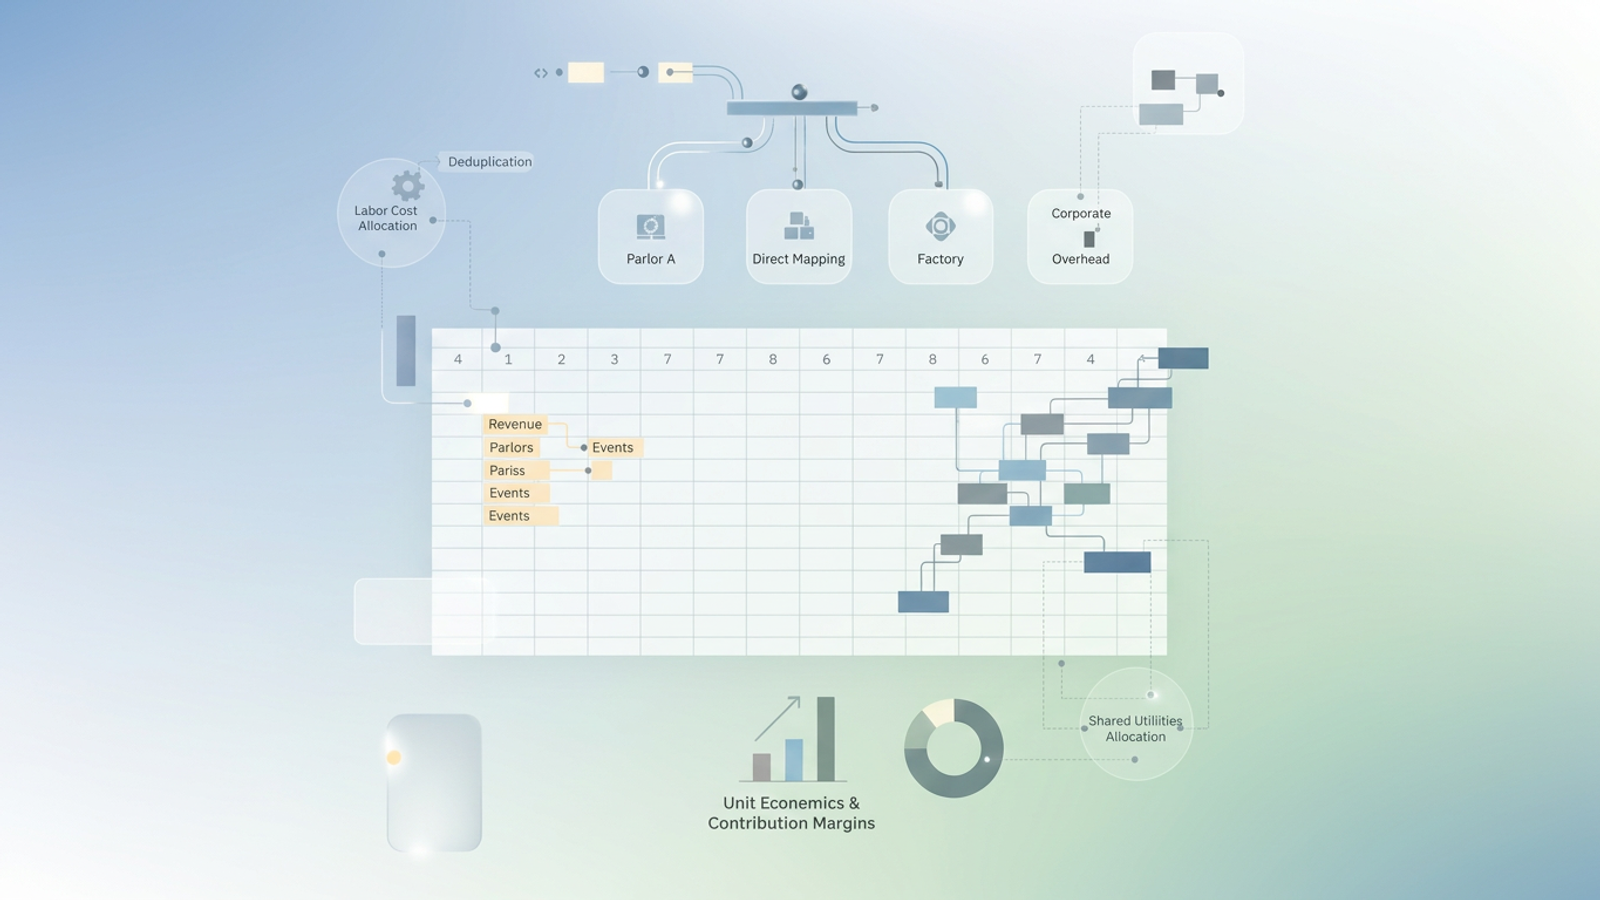
1. Ingesting data and deduplicating bank imports
The first step is pulling in raw POS revenue data and extensive lists of bank transactions. Because Quadratic connects directly to live data sources and databases, you can bring this raw information straight into the browser-based canvas.
A major pain point for financial controllers is dealing with multiple identical transaction imports, which easily leads to double-counting costs. In Quadratic, you can write iterative logic using Python or SQL directly in the grid to automatically identify and deduplicate these identical imports. Furthermore, custom cleanup rules can quickly parse and standardize incomplete or truncated POS data so your baseline revenue figures are accurate.
2. Mapping direct costs and revenue by location
Once the data is clean, the next step is attributing clear-cut revenues and costs directly to specific units like Parlor A, Parlor B, Events, and the Factory. Direct mapping is relatively simple for location-specific supplier invoices or dedicated retail staff.
However, labor costs often require more attention. Employees might float between a retail parlor and a special event in the same pay period. Using Quadratic, operators can iteratively refine labor cost allocation by joining payroll data with location-specific scheduling data, ensuring every dollar of labor is mapped to the correct operating unit.
3. Allocating shared costs and corporate overhead
Addressing shared expenses is arguably the most complex part of ice cream economics. When a direct mapping is unavailable, you need a programmatic way to distribute costs. You can use formulas in Quadratic to allocate shared rent or utility bills based on specific metrics like square footage or monthly production volume. If the factory and the corporate office share a building, you can write a custom rule to split the electricity cost accurately between the two.
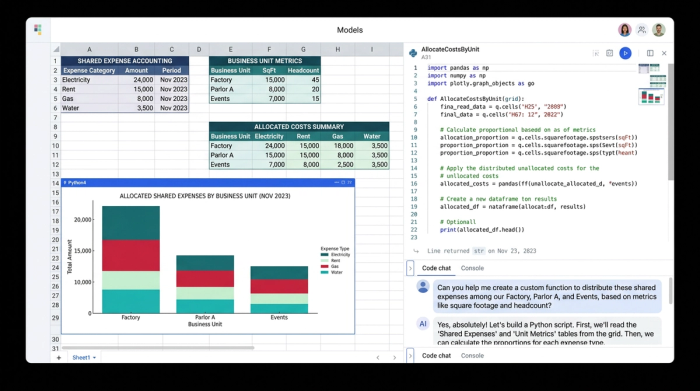
Finally, unattributed high-level administrative costs can be grouped safely into a designated corporate overhead category. This keeps unit-level metrics pure while ensuring all expenses are accounted for and ready for later allocation.
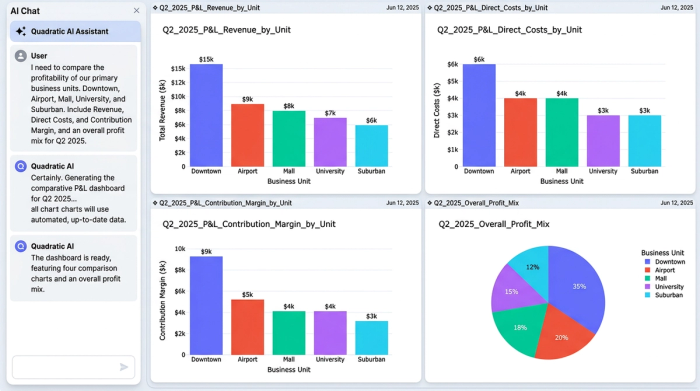
Analyzing unit economics and contribution margins
The final output of this workflow is a clean, automated monthly reporting cadence that provides clear visibility into income, costs, and true contribution margins for each specific unit. Knowing exactly which parlor is most profitable or whether pop-up events are actually dragging down factory margins allows operators to make strategic, data-driven decisions.
Beyond internal strategy, having pristine, unit-by-unit financial documentation is a massive asset. If the business plans to seek outside capital or loans for expansion, lenders will scrutinize these numbers, often requiring a detailed financial forecast. Transparent cost allocations and accurate multi-unit P&Ls are exactly what institutions look for during ice cream franchise financing.
Conclusion: agile accounting for sweet success
Moving away from manual, error-prone reconciliation to a programmatic, flexible spreadsheet environment changes how a business operates. Understanding your unit economics is not just about basic compliance. It is about scaling profitably and having the confidence to open that next location or launch a new product line. By leveraging a tool that handles code and formulas in one place, finance teams can turn chaotic transaction data into clear financial narratives. Try Quadratic to build your own custom multi-unit P&L, automate your messy POS data, and take complete control of your financial reporting.
Use Quadratic to Master Multi-Unit P&L and Cost Allocation
- Directly ingest raw POS data and bank transactions, then use Python or SQL to automatically deduplicate imports and standardize messy sales figures.
- Accurately map unit-level costs by joining payroll with location-specific scheduling data, ensuring precise labor expense attribution across parlors, events, and the factory.
- Build custom allocation rules for shared costs, like factory rent or utilities, using formulas, Python, or SQL to distribute expenses precisely based on metrics such as production volume or square footage.
- Automate your monthly multi-unit P&L, providing clear, real-time visibility into income, costs, and true contribution margins for each distinct business unit.
- Uncover which parlors are most profitable and whether pop-up events are affecting factory margins, enabling confident, data-driven decisions for scaling and financing.
Ready to take control of your ice cream economics? Try Quadratic.