
Table of contents
- Why standard web calculators aren't enough
- The math behind the curtain: how to calculate interest on a loan
- Building your custom calculator in Quadratic
- The "real data" difference: syncing with Plaid
- Analyzing scenarios: the power of extra payments
- Conclusion
- Use Quadratic to analyze and compare loan costs
Taking out a loan is often deceptively simple. With a few clicks, you can finance a car, a home, or an education. However, understanding the true cost of that borrowing—specifically the total interest paid over the life of the loan—is frequently obscured by lenders. Most borrowers look at the monthly payment and stop there, failing to see how interest accrues, how the principal declines, or how a single extra payment could save them thousands of dollars.
The standard tools available online are usually "black boxes." You input your numbers into a generic web form, and it spits out a monthly payment. You rarely get insight into the underlying math, and you certainly cannot see how those variables interact over time. Furthermore, these tools are isolated. You might use one website for a mortgage and a completely different interface for a car loan interest calculator, making it difficult to get a holistic view of your debt.
There is a better way to manage debt analysis. By building a dynamic loan interest calculator in Quadratic, you can move beyond static web forms. You can construct a transparent model that handles any type of debt, allows for complex scenario planning, and—crucially—syncs with live bank data via Plaid to track your actual progress against your theoretical model.
Why standard web calculators aren't enough
If you search for a calculator online, you are generally looking for a snapshot in time, often encountering the limitations of online calculators. These tools assume a "perfect world" scenario where you pay exactly the scheduled amount on the exact due date for the next thirty years. They do not account for real-life variables, such as making an erratic extra payment, refinancing halfway through the term, or missing a payment. As soon as your real loan deviates from the original schedule, the static calculator becomes obsolete.
There is also an "apples to oranges" problem regarding how these tools are categorized. Comparing the output of a student loan interest calculator with an auto loan interest calculator often requires opening multiple browser tabs and manually copying data into a spreadsheet. The underlying math is largely the same, but the interfaces prevent you from analyzing your debts side-by-side.
Quadratic solves this by offering an infinite canvas where Python code and spreadsheet formulas live together. You can model all your debts in a single view, creating a universal calculator that adapts to your specific financial situation rather than forcing you into a lender’s pre-set template.
The math behind the curtain: how to calculate interest on a loan
To build a better model, you first need to understand the mechanics that generic tools hide. While a simple interest loan calculator is sufficient for short-term personal loans where interest is calculated only on the principal amount, most major debts (mortgages, cars, student loans) are amortized.
Amortization means the loan is paid off over a set period with equal periodic payments. However, the composition of those payments changes over time. To calculate interest on loan schedules effectively, you need three primary variables:
- Principal ($P$): The amount of money you borrowed.
- Interest Rate ($r$): The annual rate, usually divided by 12 to get the monthly rate.
- Number of Periods ($n$): The total number of payments (e.g., 360 for a 30-year mortgage).
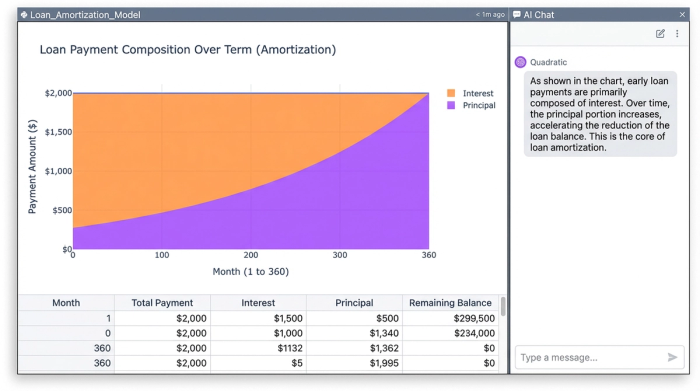
The critical concept to visualize is the split between interest and principal. In the early stages of a loan, the majority of your payment goes toward interest, effectively "renting" the money from the bank. As the principal balance decreases, the interest portion shrinks, and more of your payment goes toward equity. Understanding this curve is the key to realizing why making extra payments early in the loan term is so powerful.
Building your custom calculator in Quadratic
Creating your own tool gives you control and transparency. In Quadratic, this workflow combines standard spreadsheet logic with the flexibility of Python.
Step 1: Setting up the inputs
Start by designating cells for your variables: Loan Amount, Annual Percentage Rate (APR), and Loan Term (in years or months). Because you are building the logic yourself, this single setup works for any debt type. It can function as a car loan interest rate calculator one moment and a tool for mortgage planning the next, simply by changing the input cells.
Step 2: The amortization schedule
Next, you generate the payment schedule. In a traditional spreadsheet, you might drag formulas down 360 rows. In Quadratic, you can use Python to generate the entire schedule instantly, or stick to familiar formulas like PMT (to find the monthly payment), IPMT (to calculate the interest portion of a specific payment), and PPMT (to calculate the principal portion).
By explicitly calculating these columns, you expose exactly how much money is being lost to interest every month, rather than just seeing a single "Total Payment" figure.
Step 3: Handling edge cases
Because you are not locked into a rigid web interface, you can adjust the formulas for unique scenarios. For example, if you are modeling an investment property or a bridge loan, you can easily adjust the logic to build an interest only loan calculator, where the principal remains flat for a set period before amortization kicks in.
The "real data" difference: syncing with Plaid
The most significant limitation of a standard spreadsheet or web calculator is that it is hypothetical. It represents what should happen, not what is happening. Quadratic bridges this gap by integrating directly with Plaid.
This feature allows you to connect your actual loan accounts—whether it is a student loan provider, a mortgage lender, or a credit union—directly to your spreadsheet. Instead of manually updating your "Current Balance" cell every month, Quadratic pulls the live balance straight from your bank.
This capability transforms your loan interest calculator from a static model into a live tracker, much like a cash flow calendar helps manage daily finances. You can set up a comparison that checks your theoretical amortization schedule against your real-world balance. If the numbers diverge, you can instantly see if you are falling behind due to accrued interest or if you are ahead of schedule due to extra payments. It provides a level of financial clarity that a generic calculator simply cannot match.
Analyzing scenarios: the power of extra payments
Once your model is live, the real value comes from scenario analysis. The most important metric to watch is "Total Interest Paid."
You can use your Quadratic model to simulate the impact of behavioral changes, such as those implemented with a debt snowball tracker. For instance, ask the question: "What happens if I pay an extra $100 per month?" In a standard auto loan interest calculator, you might see that your payoff date moves up. In your custom model, you can calculate exactly how much interest that $100 saves you over the life of the loan.
Because Quadratic supports Python visualization libraries, you can graph these scenarios instantly. You can plot two lines: one representing the standard payment path and one representing the accelerated path. Visually seeing the gap between the two lines—representing thousands of dollars in saved interest—is a powerful motivator for debt repayment. You can apply this same logic to act as a car loan interest calculator to determine if refinancing at a lower rate is worth the closing costs.
Comparing loan offers side-by-side
When you are in the market for a new loan, you are often presented with competing offers: one might have a lower interest rate but high origination fees, while another has no fees but a higher rate.
By summing the total cost (Fees + Total Interest) for both offers over the expected duration you plan to hold the loan, you can apply a total cost analysis framework to mathematically determine which offer is cheaper, rather than guessing based on the APR alone.
Conclusion
Understanding your debt requires more than a static number generated by a bank's website. It requires a dynamic tool that offers transparency, flexibility, and a connection to reality. By building a loan interest calculator in Quadratic, you gain the ability to verify the math, model complex scenarios, and sync with live data to track your actual progress.
Stop guessing with generic web tools that treat every loan the same. Start modeling your actual financial life with this tool and other personal finance templates designed for deep analysis and data connectivity.
Use Quadratic to analyze and compare loan costs
- Build dynamic, transparent loan interest calculators that reveal the underlying math for any debt type.
- Model complex scenarios—like extra payments or refinancing—to understand their exact impact on total interest paid.
- Connect directly to live bank data via Plaid to track your actual loan progress against theoretical amortization schedules.
- Compare multiple loan offers side-by-side, factoring in both interest and fees, to determine the true total cost.
- Visualize the impact of different payment strategies instantly with Python, seeing thousands in potential interest savings.
- Consolidate all your loan analyses into a single, flexible workspace, eliminating the need for disparate online tools.
Take control of your debt analysis. Try Quadratic.