
Managing corporate liquidity across multiple borders is a top priority for treasury teams, especially when managing liquidity in uncertain times. Instead of choosing between tedious manual data entry or purchasing an expensive and rigid liquidity management system, modern finance leaders are turning to a new approach.
However, relying on a traditional currency exchange spreadsheet often forces finance professionals into a painful cycle of manual updates. Instead of choosing between tedious manual data entry or purchasing an expensive and rigid treasury management system, modern finance leaders are turning to a new approach. They are using Quadratic to automate real time currency exchange rates Excel workflows, adjust for regional holidays, and visualize rolling forecasts instantly.
The challenge: multi-currency liquidity in traditional spreadsheets
Standard spreadsheet tools are foundational to finance, but they quickly become liabilities when managing complex treasury operations. The friction of getting real time currency exchange rates in Excel sheet environments is a well-known hurdle for treasury teams tasked with multi-currency liquidity management. Analysts usually have to rely on clunky third-party add-ins, manual copy-pasting from web portals, or delayed end-of-day data dumps.
This reliance on static data introduces significant risk. When foreign exchange rates are delayed, teams face inaccurate working capital roll-forwards, poor cash visibility, and unmanaged FX risk—which, according to PwC's Global Treasury Survey, remains one of the most critical challenges facing modern treasurers. Finance professionals need a way to automate these inputs without losing the flexibility of a grid-based workspace.
Building a modern 13-week cash flow model in Quadratic
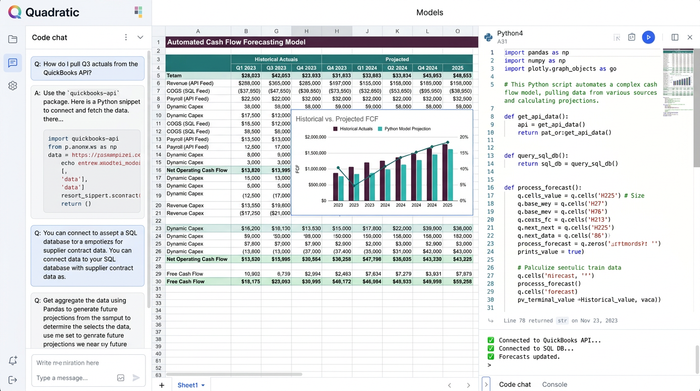
To solve these liquidity challenges, one finance professional recently used Quadratic to build a fully automated, multi-currency cash flow forecasting tool. Quadratic combines the familiar grid of a spreadsheet with the power of native Python, SQL, and direct API connections. This creates a flexible workspace capable of handling complex currency exchange Excel workflows without the usual manual overhead. While many teams begin with a static financial forecast template, aligning the model with cash forecasting best practices requires a foundation of accurate, dynamic transaction data.
Step 1: ingesting and categorizing transaction data
The foundation of any cash flow forecast is accurate transaction data. The user started by pulling in financial records from various business systems directly into the Quadratic grid. This included both one-time capital expenditures and recurring operational payments. By organizing and categorizing income and expenses dynamically, the model could track total inflows and outflows with precision to set the stage for deeper analysis.
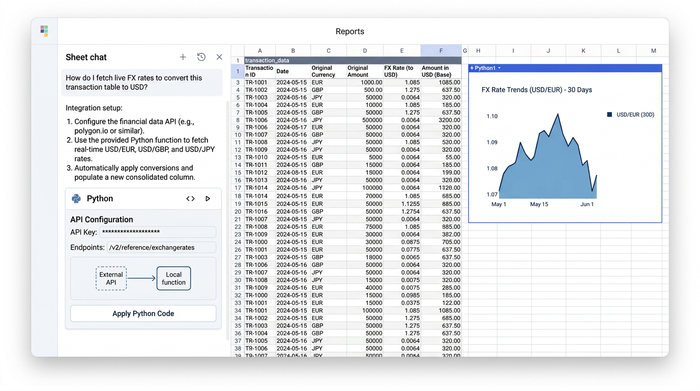
Step 2: integrating real-time FX rates via API
Managing multiple currencies is where traditional tools typically break down. To bypass the usual limitations, the user leveraged a financial api integration directly within their Quadratic workspace. To bypass the usual limitations, the user connected a reliable financial data API directly into their Quadratic workspace. This setup automatically pulled the real time currency exchange rates Excel users normally struggle to obtain. With live data flowing directly into the grid, every multi-currency transaction was instantly and accurately converted into a single base currency to eliminate hours of manual reconciliation.
Step 3: advanced logic for regional public holidays
Accurately predicting when cash will actually move is a niche but critical treasury pain point. Public bank holidays vary by region and can significantly delay expected payment dates. Because Quadratic supports integrated programming capabilities like Python right alongside standard formulas, the user wrote custom logic to account for these delays. The model automatically references a schedule of regional public holidays and shifts recurring payment dates forward if they fall on a non-business day. To achieve the best financial reporting, a forecast must be easy for stakeholders to understand.
Step 4: tracking treasury KPIs and visualizing the forecast
A forecast is only useful if stakeholders can easily understand it. While many platforms ignore the importance of native charting, Quadratic allows users to build visualizations directly next to their data. The finance professional generated rolling weekly and monthly cash flow projections to track top treasury KPIs like cash balances, total inflows, total outflows, and overall cash visibility. By embedding built-in charts directly in the spreadsheet canvas, the user made the entire 13-week forecast instantly presentation-ready for the CFO and executive team.
Why treasury teams are moving beyond the basic currency exchange spreadsheet
The strategic benefits of this modern workflow are clear. Maintaining a static currency exchange Excel file requires hours of tedious weekly maintenance and leaves room for human error. In contrast, the Quadratic model functions as an automated and living application. Data updates automatically, payment dates shift intelligently, and charts reflect the latest numbers in real time. This approach bridges the gap between the flexibility of traditional spreadsheets and the raw power of enterprise automation.
Conclusion
Automating a 13-week cash flow forecast transforms treasury management from a reactive chore into a strategic advantage. By integrating live FX data and custom payment logic for regional holidays, finance professionals can gain complete visibility into corporate liquidity. You no longer have to settle for manual workarounds or rigid enterprise software. Sign up for Quadratic today and start building your own automated treasury and cash flow models with the speed and intelligence of AI.
Use Quadratic to automate real-time currency exchange rates
- Connect directly to financial APIs to pull live FX rates straight into your sheet, eliminating the need for manual copy-pasting or fragile Excel add-ins.
- Use native Python inside the grid to build custom logic that automatically adjusts forecast payment dates for regional bank holidays.
- Consolidate multi-currency transactions into a single base currency instantly, keeping your 13-week cash flow forecasts accurate and reliable.
- Build dynamic charts and visualizations directly next to your financial data to present rolling liquidity projections to leadership.
- Schedule your spreadsheet to run automatically in the background, ensuring your treasury models stay updated without manual intervention.
Ready to simplify your multi-currency forecasting and build automated financial models? Try Quadratic