Deciding between buying a home and renting is arguably the most significant financial fork in the road for most adults. When you are standing on the precipice of a thirty-year mortgage commitment, "gut feeling" is not a sufficient strategy. You need cold, hard data.
Most people start their journey with a standard rent vs buy calculator found on real estate listing sites or bank portals. These tools are useful for a high-level overview, but they often function as "black boxes." You input a few static numbers—current rent, home price, interest rate—and the machine spits out a generic answer regarding which option is cheaper over time.
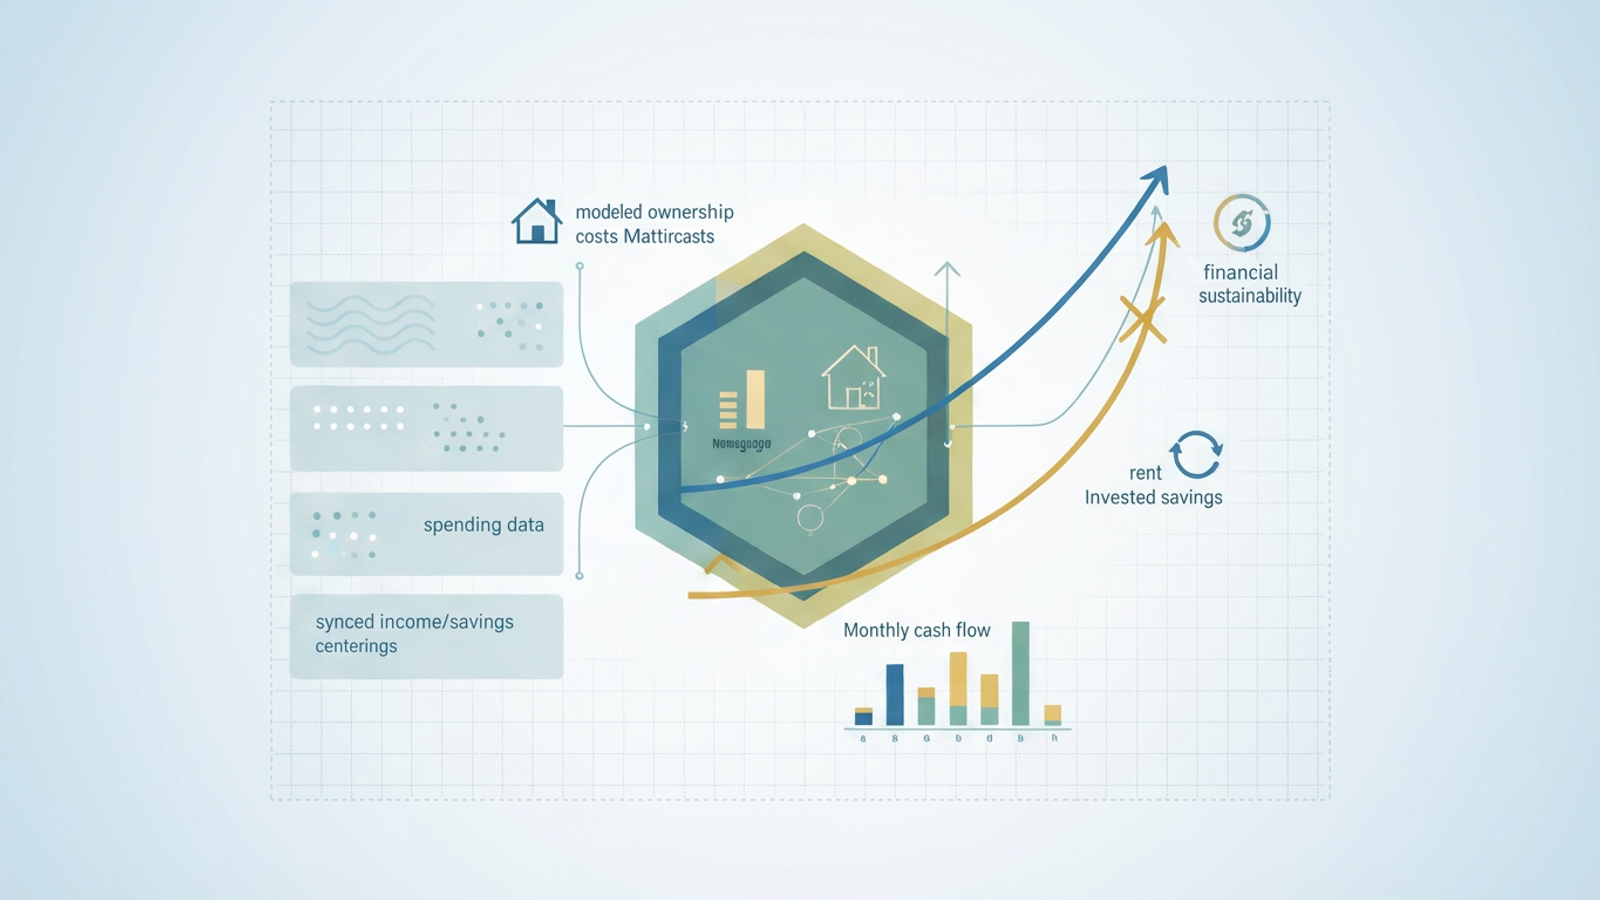
However, these calculators miss a critical component of your financial reality: sustainability. They can calculate if a home is a good investment in a vacuum, but they rarely tell you if the purchase fits your actual, fluctuating cash flow. By moving this analysis into Quadratic, you can build a dynamic financial model that connects to your real banking data. Instead of relying on averages, you can create a personalized tool that determines not just if buying is cheaper, but if it is sustainable for your specific financial life.
The problem with standard web calculators
If you have been researching the housing market, you have likely used the New York Times rent vs buy calculator. It is widely considered the industry gold standard because of its comprehensive list of variables and clean visualization. It allows you to toggle sliders for investment returns, inflation, and home appreciation, offering a sophisticated look at the long-term comparison between the two paths.
However, even the best web-based buying vs renting calculator has limitations. The primary issue is the "static data" gap. These calculators require you to estimate your future savings, your monthly spending, and your maintenance costs. They assume these variables remain constant or grow at a perfectly linear rate. They do not know that you tend to spend more in December, or that your income fluctuates with quarterly bonuses.
Furthermore, there is a distinct difference between value and affordability. A web calculator might tell you that buying a home is a better value over ten years because the asset appreciation outweighs the rent payments. That is a calculation of net worth. However, it does not calculate monthly liquidity. It does not warn you that in year two, a combination of property taxes and a broken furnace might drain your checking account to zero, even if your "net worth" is technically rising. To make a truly informed decision, you need a model that accounts for both the long-term investment view and the month-to-month cash flow reality.
Why you need a data-connected rent vs buy calculator
To bridge the gap between theoretical value and actual affordability, you need a calculator that lives where your data lives. This is where building a model in Quadratic changes the equation. Quadratic is an AI-powered spreadsheet that integrates native Python and SQL directly into the grid. This allows you to build a calculator that is not just a grid of static numbers, but a living application connected to your financial history.
One of the distinct advantages of renting vs buying is the flexibility and liquidity renting provides. When you buy, you are locking large portions of your capital into an illiquid asset. To model this accurately, you need to see your historical spending patterns. In Quadratic, you can connect directly to your bank accounts or import transaction histories via CSV.
By using Python within the spreadsheet, you can clean and categorize twelve months of actual transaction data to determine your true "cash flow available for housing." This replaces the guesswork of "I think I can save $500 a month" with the reality of "My average surplus over the last year was actually $350."
Additionally, a custom model allows for complex scenario modeling. Life is rarely linear. You might want to know what happens to your break-even point if you get a promotion in year three, or if insurance premiums in your area spike by 20% next year. A rigid web tool cannot easily accommodate these specific "what-if" scenarios, but a Python-backed model in Quadratic can run these simulations instantly, giving you a comprehensive view of rent vs buy decision factors.
Key factors: What goes into the model?
Before you start writing code or formulas, it is essential to define the variables that will drive your model. Many first-time buyers mistakenly view the comparison as simply "Mortgage Payment vs. Rent Payment." This is a dangerous oversimplification. To accurately weigh the pros and cons of renting vs. buying, you must compare the "unrecoverable costs" of both options.
When you rent, the unrecoverable cost is the rent itself. You pay it, and it is gone. When you buy, the mortgage principal is actually savings—it is money you pay to yourself in the form of equity. The unrecoverable costs of buying are mortgage interest, property taxes, homeowner's insurance, HOA fees, and maintenance. A robust model compares the total unrecoverable costs of renting against the total unrecoverable costs of ownership.
The second major factor is opportunity cost. This is the investment angle of the buying home vs renting debate. Buying a home usually requires a substantial down payment. If you were to continue renting, that large sum of cash could be invested in the stock market. Therefore, your model must compare the future value of the home’s equity against the future value of that down payment if it were invested in a diversified portfolio (like the S&P 500).
Building the workflow in Quadratic (Step-by-Step)
Creating this calculator in Quadratic allows you to combine the ease of a spreadsheet interface with the power of Python for the heavy lifting. Here is how you can structure the workflow.
Step 1: Syncing your finances
The foundation of a sustainability model is accurate income and expense data. In a standard spreadsheet, you might manually enter your last few pay stubs. In Quadratic, you can use data connectors to pull in raw transaction data. Once the data is in the sheet, you can use a Python cell to clean the data—filtering out internal transfers and categorizing expenses—to arrive at a "True Monthly Burn Rate." This figure reveals how much cash you actually have left over for a mortgage payment, removing the optimism bias that often plagues manual budgeting.
Step 2: Defining assumptions
Next, set up a dedicated parameters section in your spreadsheet. This is where you define the variables for your scenario:
- Home Price
- Down Payment Percentage
- Mortgage Interest Rate
- Property Tax Rate
- Maintenance Reserve (usually 1-2% of home value annually)
- Expected Market Return (for the renter's portfolio)
- Expected Home Appreciation
Because these are cells in a spreadsheet, you can easily change them later to see how sensitive your model is to interest rate changes or market downturns.
Step 3: The Python logic
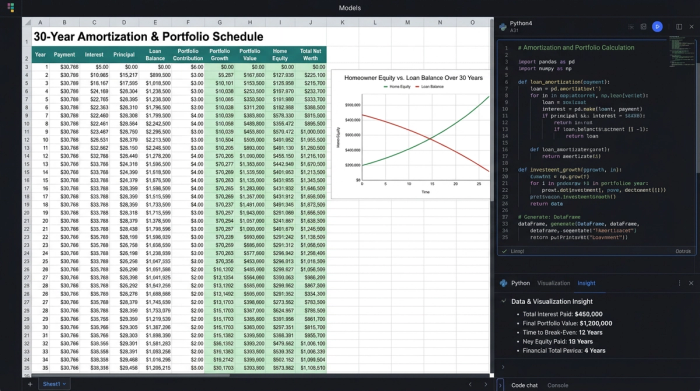
This is where Quadratic differentiates itself from Excel or Google Sheets. Calculating a 30-year amortization schedule alongside a compounding investment portfolio using standard formulas can result in a messy, fragile sheet with thousands of rows of dragged-down formulas.
You can write a script that loops through 360 months (30 years). For each month, the script calculates the interest paid, the principal paid, the maintenance costs, and the tax implications. Simultaneously, it calculates the growth of the compounding investment portfolio—the cash they invested instead of using it for a down payment.
The output of this Python cell is a clean DataFrame containing the month-by-month net worth for both the "Buy" and "Rent" scenarios. This keeps your spreadsheet clean, auditable, and incredibly fast.
Step 4: The output visualization
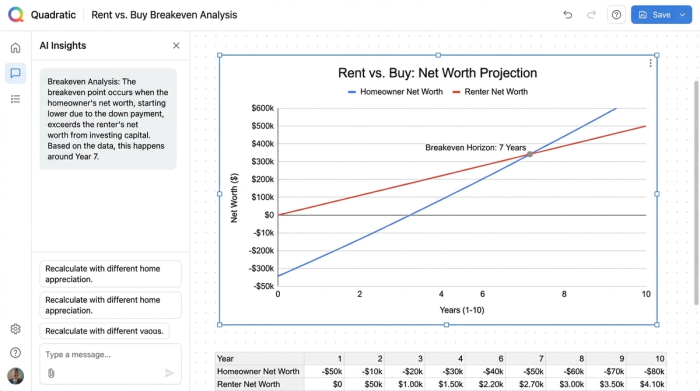
Finally, you visualize the data. Using Quadratic’s charting capabilities, you can plot the "Net Worth: Buy" and "Net Worth: Rent" lines on a single graph. This provides the classic "X" shape, showing where the lines cross. However, because you have the raw data, you can also plot a second chart: "Monthly Cash Flow." This is the sustainability check, showing exactly how much cash is leaving your bank account each month in both scenarios.
Interpreting the results: The breakeven horizon
Once your model is running, the first thing to look for is the breakeven point. This is the moment in time where the net worth of the homeowner surpasses the net worth of the renter. In many markets, this might be year five or year seven. If you plan to move before that date, the math suggests renting is the superior financial choice.
By seeing your actual spending data alongside the projected mortgage costs, you can assess the risk of becoming "house poor." However, the most critical insight comes from the cash flow reality check. You might find that the rent vs buy calculator shows buying is a better long-term wealth builder. But if your "Monthly Cash Flow" chart shows that the costs of ownership (mortgage + taxes + maintenance) exceed your "True Discretionary Income" calculated in Step 1, the purchase is not sustainable.
This specific insight is often lost in generic web tools. A house that makes you rich in thirty years but bankrupts you in two is not a good investment. By seeing your actual spending data alongside the projected mortgage costs, you can assess the risk of becoming "house poor."
You can also use the model to highlight the specific advantages of renting vs buying in your specific market. For example, if your rent is significantly lower than the unrecoverable costs of buying, your model will show that renting and aggressively investing the difference yields a higher net worth for a much longer period, perhaps pushing the breakeven point out to 15 or 20 years.
Customizing your decision model
The beauty of building this in Quadratic is that it is not a rigid application; it is a flexible environment. Once the baseline logic is built, you can treat it as a living financial plan.
You can add complexity that web calculators cannot handle. For example, you can model "house hacking"—renting out a spare room for the first three years. You simply add a line of code in your Python script to inject extra income for months 1 through 36. You can model a refinance scenario, testing what happens if rates drop by 2% in year five.
This transforms the tool from a one-time \"yes or no\" calculator into a strategic map for your financial future. You can even adjust for lifestyle inflation. Standard calculators assume you save the same amount forever. In your model, you can introduce a variable that increases your spending as your income rises, providing a more conservative and realistic view of your future savings potential.
Conclusion
There is no single right answer to the buying home vs renting debate. In some markets, buying is a no-brainer; in others, renting is the savvy financial move. The answer depends entirely on the math—specifically, your math.
Relying on a "black box" calculator requires you to trust algorithms that do not know your spending habits, your risk tolerance, or your career trajectory. By using Quadratic, you gain transparency and control. You can see exactly how the numbers are calculated, you can stress-test your assumptions against real data, and you can ensure that your decision is based on the reality of your bank account rather than industry averages.
When you are ready to stop guessing and start modeling, you can open a new sheet in Quadratic and begin building a tool that gives you the confidence to make the right move.
Use Quadratic to build a dynamic rent vs buy calculator
- Connect directly to your bank accounts or import transaction data to accurately model your "True Monthly Burn Rate" and available cash flow, moving beyond static estimates.
- Leverage native Python within the spreadsheet to build robust, multi-year amortization schedules and investment portfolio projections without complex, error-prone formulas.
- Model complex "what-if" scenarios, such as income changes, interest rate shifts, or unexpected maintenance costs, to understand their real impact on your financial sustainability.
- Visualize both long-term net worth comparisons and critical month-to-month cash flow, ensuring your decision considers both investment value and immediate affordability.
- Customize your model with unique factors like "house hacking" or lifestyle inflation, creating a personalized financial tool that adapts to your evolving financial life.
Ready to make a data-driven decision about your next home? Try Quadratic.