
Table of contents
- The boardroom translation: What senior leadership actually wants
- The execution gap: Why retail media companies need flexible data tools
- Step-by-step: Building a board-ready PR impact report in Quadratic
- Why custom workspaces outperform traditional PR tools
- Conclusion
- Use Quadratic to simplify retail media analytics
Successfully presenting marketing KPIs to the board is one of the most high-stakes tasks for any retail marketing leader, especially when translating PR and media results into clear business outcomes. The board does not want to hear PR jargon or surface-level vanity metrics.
They want to see tangible business value, a clear return on investment mapped to a marketing funnel template, and visual narratives that prove strategic impact. The secret to delivering a compelling board presentation lies in advanced retail media analytics. Instead of relying on rigid, pre-built dashboards that limit your story, controlling your own data allows you to craft a precise, authoritative report that speaks directly to leadership.
The boardroom translation: What senior leadership actually wants
When senior leadership reviews marketing performance, they expect strategic KPIs, conciseness, and data-driven storytelling. The challenge for fashion and retail brands is that media coverage rarely lives in a single ecosystem. Teams must integrate traditional earned media channels like print and broadcast with digital PR across web and social channels, often pulling referral traffic metrics from a custom dashboard Google Analytics. The board expects one cohesive narrative rather than siloed reports that leave them guessing about the overall impact.
This is where standard retail media analytics platforms often fall short. Many of these tools operate as black boxes. They provide pre-calculated metrics but do not allow marketing teams to build custom models or calculate a brand's unique media impact value. When you cannot see or adjust the underlying math, translating those numbers into a language the board understands becomes incredibly difficult.
The execution gap: Why retail media companies need flexible data tools
Most industry guides, including standard methodologies like the AMEC Integrated Evaluation Framework, will tell you to track metrics like share of voice or media value, but they rarely explain how to actually wrangle the messy CSV exports generated by various media monitoring tools. Retail media companies real-time data analytics strategies frequently fail when professionals are forced to manually copy and paste data across traditional, disconnected spreadsheets.
Quadratic provides the ideal workspace to bridge this execution gap. It offers an infinite canvas that combines the familiar interface of a spreadsheet with the native power of Python and SQL. This allows data analysts and communications professionals to merge, analyze, and visualize disparate datasets in real time without ever leaving the browser.
Step-by-step: Building a board-ready PR impact report in Quadratic
Creating a consultative, high-level board report requires synthesizing complex datasets into clear insights. Here is exactly how a marketing professional in the fashion and retail space can use Quadratic to build a comprehensive media performance report.
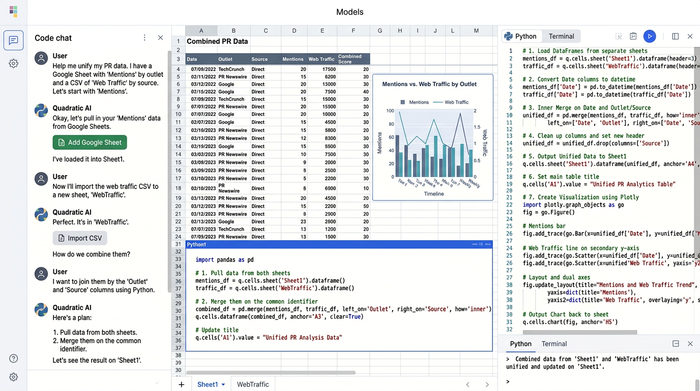
Step 1: Merging traditional and digital datasets
The first step is bringing your distinct data sources into a single environment. In Quadratic, you can easily import your traditional media coverage CSV, which might include details like publication name, date, estimated value, and readership. Right next to it, you can import your digital web coverage CSV, containing website names, dates, article values, and monthly users.
Instead of relying on fragile spreadsheet functions to link these files, Quadratic allows you to seamlessly join these datasets using SQL or Python directly in the grid. This creates a reliable single source of truth where print and digital data live side by side, ready for deeper analysis.
Step 2: Calculating custom KPIs and media value
With your datasets merged, you can build a custom KPI calculator to standardize metrics across all channels. Because Quadratic supports native Python and SQL alongside standard spreadsheet formulas, you have complete control over your calculations. You can determine total media impact value, cost-per-impression, or overall ROI based on your brand's unique formulas.
By avoiding the black-box trap of rigid software, you ensure every number is transparent and defensible. As new data flows in or variables change, your formulas update automatically. This capability provides the best real-time data analytics for retail media, ensuring your board report is always accurate and up to date.
Step 3: Visualizing trends, geography, and top outlets
A board of directors needs visual context, not just rows of data tables. Once your KPIs are calculated, you can create a dashboard in Python right inside Quadratic to highlight key performance indicators. You can build line graphs to show monthly and semiannual coverage trends, mapping out how specific campaigns performed over time.
You can also create visual geographical distribution analyses to see exactly where your PR efforts are hitting hardest, along with a ranked bar chart breaking down your top-performing media outlets. Having these charts live directly next to your raw data and code builds immense trust. If a board member asks a probing question during the presentation, you can adjust the parameters on the fly and provide an instant, data-backed answer.
Why custom workspaces outperform traditional PR tools
When evaluating the best marketing data visualization tools for real-time retail media analytics, flexibility and transparency are the most critical factors. Traditional PR tools force you into their way of thinking, while a custom workspace adapts to your specific business needs. By owning the data integration and calculation process, PR and marketing professionals can establish clear marketing attribution models and evolve from simply reporting past metrics to providing consultative, forward-looking strategic insights.
Conclusion
Reporting PR impact to the board requires stripping away industry jargon, seamlessly merging traditional and digital data, and presenting a highly visual story backed by transparent math. It is time to stop wrestling with messy CSV exports and rigid PR software that limits your analytical potential. Try Quadratic to build your next board report. With its infinite canvas, built-in Python and SQL, and powerful data visualization capabilities, you can turn raw media data into clear strategic insights faster than ever before.
Use Quadratic to simplify retail media analytics
- Combine traditional and digital media datasets on an infinite canvas without manual copy-pasting.
- Use native SQL or Python to clean and join messy CSV exports from various media monitoring tools.
- Calculate custom KPIs and media impact value using transparent formulas instead of black-box software.
- Build visual dashboards with trend lines, geographical distribution charts, and ranked outlet tables right next to your raw data.
- Connect directly to live data sources like Google Analytics to keep your board reports updated automatically.
Stop struggling with messy CSV exports and rigid reporting tools. Build your next board report on an infinite, code-native canvas to clearly demonstrate your strategic impact. Try Quadratic