
James Amoo, Community Partner
Apr 30, 2026

Tracking daily active users or monthly active users might look great on a slide deck, but these vanity product management metrics rarely tell the whole story. The real challenge lies in tracking meaningful feature adoption metrics and understanding exactly how, why, and when users extract value from your features. When product managers evaluate the best product analytics tools for adoption tracking without a clear methodology in place, they often end up with disconnected data and superficial insights.
Effective adoption tracking requires a solid data infrastructure and analytics strategy. Only then can you select tools that support deep and cross-functional analysis and tie product usage analytics to actual business outcomes.
Why strategy must precede software selection
It is tempting for product managers and growth teams to jump straight into generic software solutions to find a quick fix. However, strategy must always precede software selection. There is a massive difference between superficial clicks, like a simple login, and the meaningful user behaviors that actually drive long-term retention.
If you start by looking for the best product analytics tools for adoption metrics before defining what adoption means for your product, you risk forcing your team into rigid reporting structures. The right product analytics tool must map precisely to your specific user journey. It should adapt to your product's unique workflow rather than dictating how you measure success.
Another critical consideration is alignment across teams. Without a clearly defined data analytics strategy, different stakeholders may interpret key metrics in conflicting ways, leading to inconsistent reporting and poor decision-making. By establishing a shared definition of success, you ensure that any tool you adopt reinforces a unified understanding of performance.
The adoption tracking methodology
Before evaluating software features, you need a foundational playbook that any tool you select must be able to execute. This involves a step-by-step process for establishing baselines and defining what successful adoption looks like for your specific product.
Defining meaningful milestones: activation, TTV, and "aha" moments
Time-to-Value (TTV) and the "aha" moment are the true leading indicators of successful feature adoption. TTV measures how long it takes a new user to realize the core value of your product, while the "aha" moment is the exact action that triggers that realization.
To identify these milestones, look for specific actions a user takes that strongly correlate with long-term retention. For a project management tool, it might not be creating an account, but rather inviting a teammate and completing a task. Set concrete activation milestones based on these specific behaviors rather than relying on ambiguous engagement scores.
Event design and taxonomy
A clean and consistent event taxonomy is critical for accurate adoption tracking. One of the most common pitfalls product teams face is trying to track every single click. This approach creates overwhelming data noise and leads to confusion when trying to parse out what actually matters.
Instead, advocate for a focused list of key events. Every tracked event should directly align with the business's strategic goals and tie back to your activation milestones. A well-designed taxonomy ensures that your data remains trustworthy and actionable across the entire organization.
Cohort analysis and user journey mapping
Cohort analysis allows you to group users by shared characteristics and track their feature adoption over time. This helps you understand if product updates are actually improving adoption among different user segments.
Coupled with user journey mapping, you can conduct funnel analysis and pinpoint the exact drop-off points where users abandon the product before reaching activation. These frameworks are essential prerequisites for any analytics tool under consideration. If a platform cannot cleanly execute cohort analysis or map the user journey, it will not support a strategic adoption methodology.
Key criteria for evaluating product adoption analytics tools
Once your methodology is clearly defined, you can transition to evaluating the technical requirements needed to execute it effectively. The focus should shift away from superficial feature checklists and toward capabilities that enable deep analysis.
Advanced event tracking and segmentation
Basic demographic segmentation is insufficient for tracking true product adoption. You need tools that allow highly granular user segmentation based on specific behavioral patterns.
Look for analytics platforms capable of segmenting users by the frequency of key events, the sequence of actions taken, or the time it takes to reach an activation milestone. This is what allows product teams to identify power users, at-risk accounts, and bottlenecks in the onboarding flow.
The integration gap: connecting usage to revenue
There is a critical gap in the market today: most product analytics tools keep usage data completely isolated from CRM, billing, and financial systems.
Combining product adoption data with revenue metrics is crucial for quantifying the actual business impact of user behavior. Knowing that a feature is highly adopted is helpful, but proving that its adoption correlates with higher expansion revenue or lower churn is what drives business strategy. Product leaders must look for solutions that break down these departmental data silos and connect the dots between product usage and the bottom line.
Custom analysis logic vs. rigid dashboards
Standard dashboards provided by many traditional platforms often come with severe limitations. They force you to view your data through their predefined lens, which rarely aligns perfectly with your custom adoption methodology.
Strategic adoption tracking requires the freedom to query and manipulate data on your team's own terms. Advocate for tools that offer custom analysis capabilities. This allows you to build tailored playbooks and apply unique logic to your datasets.
How Quadratic bridges product analytics and business outcomes
Adoption tracking often breaks down at the point where product usage data needs to connect with real business outcomes. Event-level insights from tools like Mixpanel are valuable, but without linking them to revenue, retention, and customer lifecycle data, they remain incomplete. Quadratic closes this gap by creating a unified environment where product analytics and business metrics are analyzed together. Let’s explore the features of Quadratic in detail:
Direct connections to multiple data sources
Quadratic connects directly to product analytics platforms, CRM systems, and billing tools, allowing teams to ingest adoption data alongside revenue and customer records. This eliminates the need for manual exports and fragmented data stitching.
With all sources unified, teams can track how specific product interactions correlate with upgrades, renewals, or churn. This creates a complete view of the customer lifecycle within a single analytical layer.
AI-powered data analysis for adoption modeling
Quadratic leverages AI agents for data analysis to help teams define and analyze adoption metrics such as feature usage frequency, activation thresholds, and engagement depth. These models can be tailored to reflect the unique dynamics of your product.
AI-assisted workflows make it easier to iterate on these definitions as your product evolves. Teams can refine their understanding of adoption without rebuilding complex queries or dashboards from scratch. Let’s see how this works.
First, I import (or connect to) my product data:
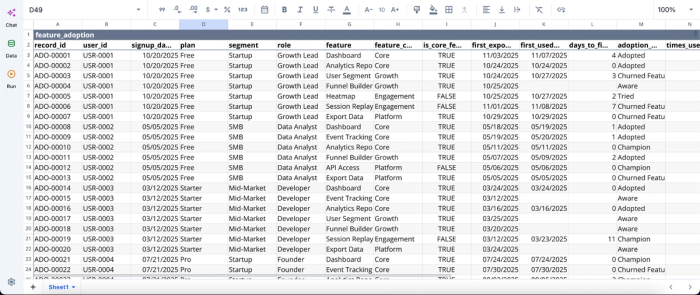
Here, I have over 4000 rows of feature adoption user data. Writing complex formulas or SQL for data analysis might take hours to implement. With Quadratic, all you have to do is ask questions about your data using text prompts, and you get your insights in seconds. Here:
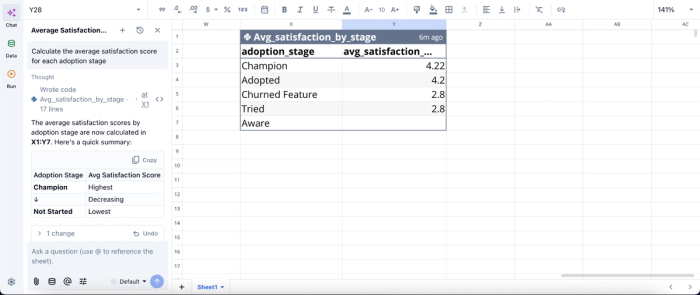
In this image, I ask Quadratic AI, “Calculate the average satisfaction score for each adoption stage.” It instantly generates a separate table that gives a breakdown of the average satisfaction by stage. From this analysis, we can immediately conclude that the champion stage has the highest satisfaction stage.
AI tools for product managers help them focus less on the technical analysis stage and more on generating insights that drive product growth.
AI data visualization for impact tracking
Quadratic enables the creation of dynamic dashboards that link product adoption metrics directly to business outcomes. Teams can visualize how engagement trends influence retention rates, expansion revenue, or customer health scores.
These visualizations update automatically as new data flows in, ensuring that stakeholders always have access to current insights. This makes it easier to communicate the value of product initiatives across the organization. Visualization in Quadratic can also be done by using text prompts. Here:
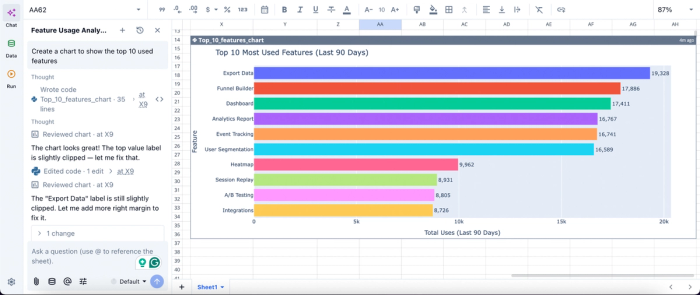
In this image, I ask Quadratic AI to “Create a chart to show the top 10 used features”. In seconds, it generates a chart that shows the top 10 most used features in the last 90 days. This makes it easy to communicate insights to product managers or non-technical stakeholders who want quick insights without looking at raw numbers.
Unified customer-level analysis
Quadratic enables teams to build a single view of each customer by linking product events with account-level data. This unified perspective is critical for understanding how individual users or accounts progress through the adoption lifecycle.
By consolidating these data points, teams can identify high-value behaviors, predict churn risk, and uncover expansion opportunities with greater precision.
Collaboration across product, growth, and finance teams
Quadratic supports real-time collaboration, enabling cross-functional teams to work together on adoption analysis. Product managers, analysts, and finance stakeholders can all contribute to and validate the same models.
This collaborative analytics platform ensures alignment on key definitions and metrics. It reduces inconsistencies and fosters a unified understanding of how product usage drives business performance.
Conclusion
Effective adoption tracking goes far beyond monitoring basic logins. It requires measuring meaningful milestones and tying them directly to concrete business outcomes. The best product analytics tools for adoption tracking support a flexible approach rather than keeping product data isolated in departmental silos.
By breaking down these barriers and combining behavioral insights with financial reality, product teams can make more strategic decisions. Quadratic allows you to connect to platforms like Mixpanel and Amplitude and build an adoption dashboard based on your product usage data. Try Quadratic for free.
Frequently asked questions (FAQs)
What should be the first step when looking for the best product analytics tools for adoption tracking?
Before evaluating any software, product teams must first establish a robust framework for defining user behavior and what successful adoption means for their specific product. This strategic approach ensures that the chosen tools can support cross-functional analysis and tie product usage to actual business outcomes.
How does Quadratic enhance product analytics tools for adoption metrics?
Quadratic acts as a bridge, connecting product usage data from tools like Mixpanel with CRM, billing, and finance records in a powerful spreadsheet interface. This allows product teams to build custom analysis logic using Python, SQL, and formulas, proving how feature adoption impacts retention and expansion directly within one collaborative environment. It helps break down data silos to connect usage to revenue.
Why is connecting product usage data to financial metrics crucial for adoption tracking?
Most product analytics tools isolate usage data from financial and CRM systems. Connecting product adoption data with revenue metrics is essential for quantifying the actual business impact of user behavior, moving beyond knowing a feature is adopted to proving its correlation with higher expansion revenue or lower churn.