How this rental property cashflow calculator works
This rental property cashflow calculator is built to evaluate real estate investments by processing property variables into clear financial metrics. It operates on a dual-sheet architecture that intentionally separates user inputs from the underlying complex calculation logic.
- Operates on a dual-sheet architecture separating user inputs from complex calculation logic.
- Calculates Net Operating Income (NOI), Monthly Cash Flow, and Cash-on-Cash ROI based on user-defined property variables.
- Uses Python code cells to generate reactive Plotly visualizations that update instantly when dependency changes occur.
- Programmatically stress-tests property metrics across five different price and rent scenarios.
Core template components
Main input interface
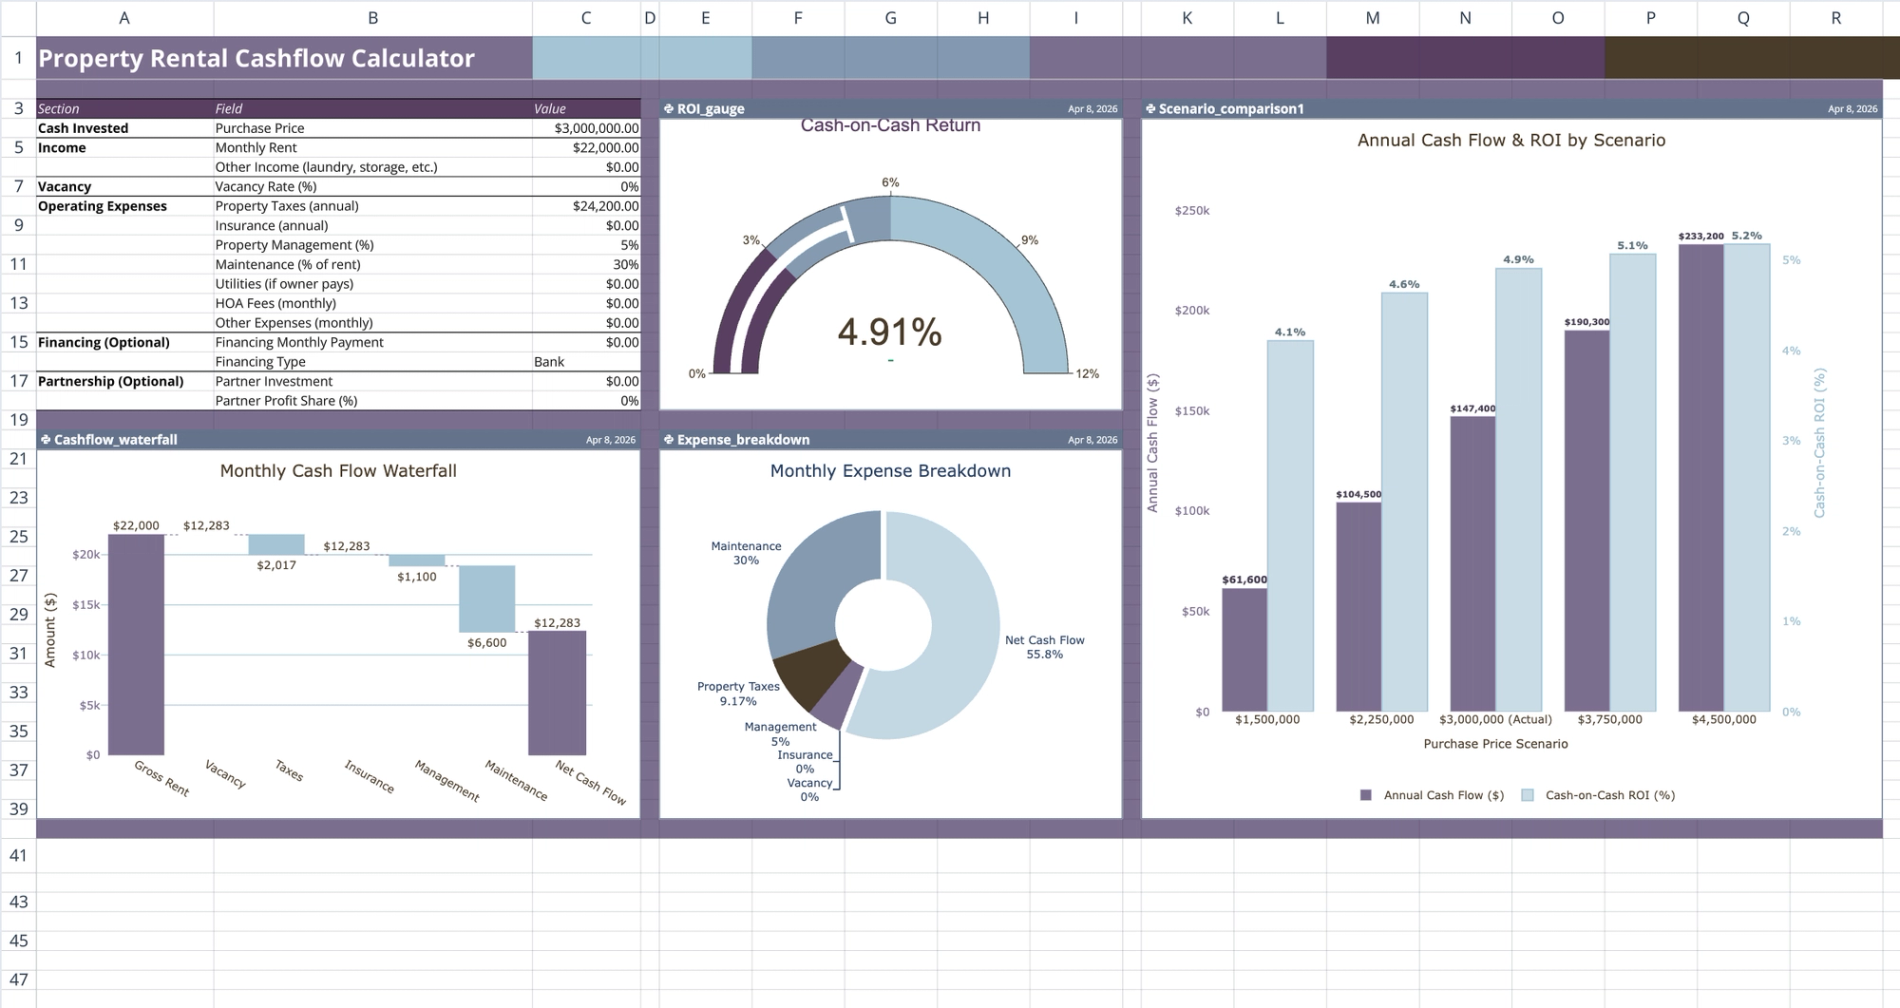
The Main sheet serves as the primary user-facing interface. It centralizes all editable fields into a single input column (C4:C18) to keep data entry straightforward and highly organized.
- Groups data into six distinct sections: Cash Invested, Income, Vacancy, Operating Expenses, Financing, and Partnership.
- Houses all four primary data visualizations directly alongside the input fields for immediate visual feedback.
Backend calculation sheet
The backend sheet handles the mathematical heavy lifting. It mirrors all user inputs from the Main sheet using direct formula references to keep the user interface clean and prevent accidental edits to core logic.
- Computes derived metrics sequentially in a single output column (column F).
- Converts annual expenses like property taxes and insurance into monthly equivalents for accurate cash flow analysis.
- Calculates Effective Gross Income, Total Monthly Expenses, NOI, Monthly Cash Flow, and final Cash-on-Cash ROI.
Python-powered Plotly visualizations
Four Python code cells read the backend outputs to render interactive Plotly charts. These charts share a consistent five-color palette and provide distinct perspectives on the property data.
- Gauge chart: Reads the backend ROI percentage and displays it on a 0 to 12% scale with three color-coded performance bands.
- Donut pie chart: Pulls individual monthly expense line items and net cash flow to show a proportional breakdown of outgoing capital.
- Waterfall chart: Plots gross rent and sequential expense deductions down to the final net cash flow.
- Scenario comparison chart: Generates five scenarios using 0.5x to 1.5x multipliers on purchase price and rent, displaying annual cash flow and ROI on dual y-axes.
How to use the calculator
Operating the tool requires moving sequentially through the input sections on the Main sheet. Because the logic is fully linked, you only need to interact with the designated input fields to run a complete analysis.
- Enter the property purchase price in the Cash Invested section.
- Input expected monthly rent and secondary income sources.
- Define operating variables, including vacancy rate, property taxes, insurance, and maintenance percentages.
- Specify monthly financing payments and partnership profit-sharing terms.
- Adjust any input on the Main sheet to instantly recalculate backend formulas and re-execute Python visualizations.
- Review the scenario comparison chart to evaluate how changes in purchase price and rent impact overall ROI.
Who this rental property cashflow calculator is for
This template provides a structured environment for professionals who need to model real estate financial performance without building complex spreadsheet logic from scratch.
- Real estate investors analyzing potential single-family or multi-family acquisitions.
- Property managers evaluating the operating efficiency of existing units.
- Investment partnerships requiring clear mathematical visibility into profit-sharing and expense distributions.
Use Quadratic to Calculate Rental Property Cashflow
- Streamline financial modeling with a clean input interface and robust backend calculations.
- Instantly visualize Net Operating Income, Monthly Cash Flow, and Cash-on-Cash ROI with reactive Plotly charts.
- Evaluate investment potential by stress-testing scenarios across five different price and rent conditions.
- Organize all property variables—from income to operating expenses—in a single, intuitive sheet.
- Simplify complex analysis by automatically converting annual expenses to monthly equivalents for accurate cash flow.
Related templates

Real Estate Pro Forma Template
Quickly evaluate potential real estate investments. Track income and expenses, Determine IRR and analyze equity building of real estate.
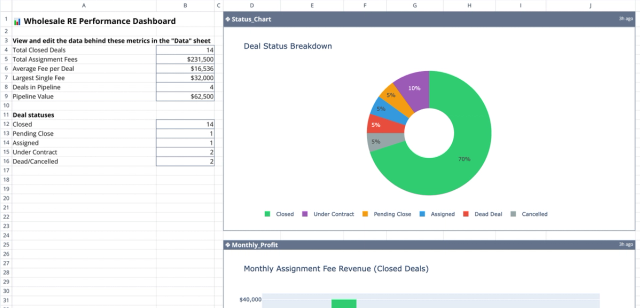
Wholesale Real Estate Calculator: Deal Analysis Dashboard
Track and visualize your real estate wholesale deals, fees, and portfolio performance.

Real Estate ROI Calculator: Investment Property Analysis
Determine profitability and return on investment for residential properties.