Table of contents
- The hidden trap in your cash flow projection format: Data errors
- Step-by-step example: Building a 90-day collection delay model
- Visualizing your cash flow projections over time
- Advanced scenario planning: Loan financing and break-even analysis
- Conclusion: Streamline your project's financial future
- Use Quadratic to build robust cash flow projections for project planning
A reliable cash flow projection is the backbone of successful project planning. For financial planners and operations leaders, mastering financial data analytics to understand exactly when money enters and leaves a business is critical for survival. However, building these models often uncovers hidden costs associated with delayed collections and the sheer frustration of broken spreadsheet formulas.
Many professionals start their forecasting journey by downloading a standard excel template for cash flow projection. They quickly discover that messy data inputs break their formulas and severely limit their ability to visualize future financial health, highlighting the need for robust financial forecasting tools. Static grids simply cannot keep up with the demands of modern financial modeling.
This article explores a real-world use case to demonstrate a better way forward. We will walk through an end-to-end workflow in Quadratic. You will see how to clean up frustrating text-to-number errors, build a multi-year model with a 90-day collection delay, visualize the data, and run complex loan financing scenarios all in one place.
The hidden trap in your cash flow projection format: Data errors
Before you can accurately forecast your financial future, your underlying data must be perfectly clean. Many financial planners spend hours on granular troubleshooting just to get their baseline numbers to calculate correctly.
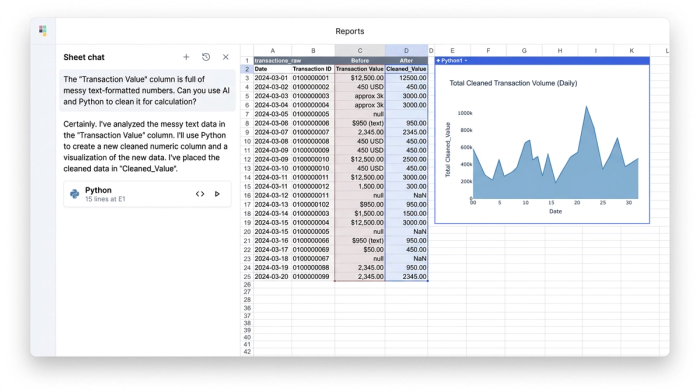
A common reality in project planning is dealing with messy data exports from various accounting tools. These exports frequently mix text and numeric values. When you attempt to run calculations on this mixed data, you are inevitably met with a wall of broken formulas and value errors. A strict cash flow projection format relies entirely on pristine data inputs to function correctly.
In our use case, the user leveraged Quadratic to instantly correct these text-formatted numbers. Because Quadratic combines the familiarity of a modern spreadsheet with built-in AI flows and native Python, enabling powerful spreadsheet automation, cleaning data is fast and intuitive. Fixing data hygiene at this foundational level is an absolute requirement before you can begin calculating monthly billing, collections, and expenses.
Step-by-step example: Building a 90-day collection delay model
Once your data is clean, you can move from basic troubleshooting to strategic modeling. For this specific internal project, the user needed to build a comprehensive multi-year model spanning from 2026 to 2030, adhering to multi-year financial modeling best practices.
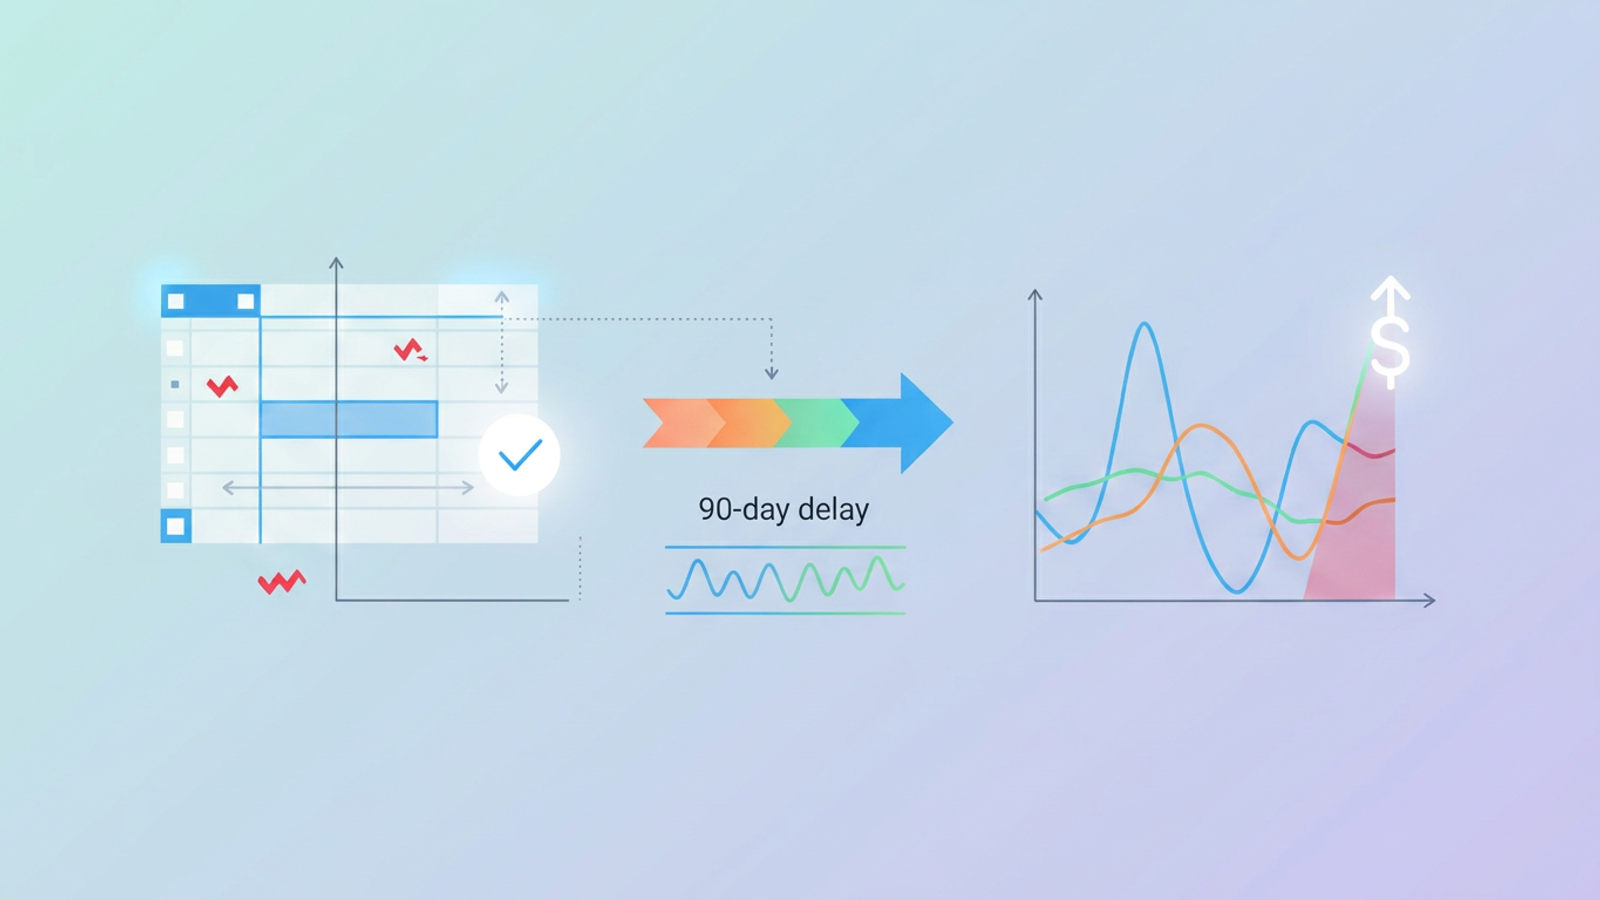
The first step is structuring your rows and columns to track monthly billed amounts, net collections, and total expenses. However, simply recording what you bill is not enough. The user needed to model a strict 90-day delay between the moment a client is billed and the moment the actual cash is collected in hand.
Capturing this 90-day delay is critical for identifying periods of financial deficit. A business might look highly profitable on paper based on billed revenue, but if the cash takes three months to arrive, the bank account could still hit zero, impacting overall project profitability and highlighting the need for robust accounts receivable management strategies. By structuring the timeline to reflect this reality, the user created a highly actionable cash flow projection example that other project managers can easily replicate. It serves as a realistic cash flow projection sample that grounds financial planning in actual cash availability rather than theoretical revenue.
Moving beyond the basic cash flow projection template
Traditional static spreadsheets struggle to handle dynamic, multi-year modeling elegantly. A standard cash flow projection template excel file, similar to a budget excel spreadsheet, often falls short when you introduce complex variables like rolling 90-day delays across a five-year timeline.
Quadratic provides a much more flexible and easily auditable structure. Because users can utilize Python, SQL, and standard formulas in the same grid, the logic behind the delay remains clear and adaptable. This prevents the model from becoming a fragile web of cell references that breaks the moment a new month is added.
Visualizing your cash flow projections over time
Project managers and operations leaders need clear financial data visualization to truly understand financial dynamics.
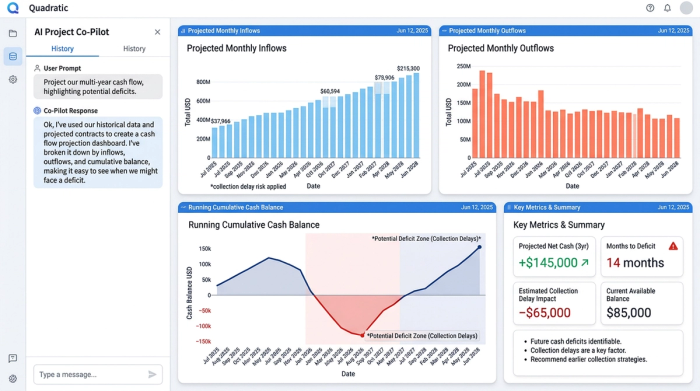
To solve this, the user built time-series visualizations directly within Quadratic. They were able to track inflows, outflows, and running cash balances side by side on a single dashboard. Graphing the cumulative cash position helps teams instantly spot cash deficits caused by the 90-day collection delay.
When you visualize your cash flow projections over a multi-year timeline, the narrative becomes undeniable. Decision-makers can see exactly when the project will dip into the red, allowing them to take proactive measures months before the deficit actually occurs.
Advanced scenario planning: Loan financing and break-even analysis
Now that the data is clean and the baseline 90-day delay is clearly visualized, the model is ready for advanced financial scenario analysis. This is where fp&a modeling delivers its highest value.
The user wanted to understand how external funding would change the project's financial trajectory. Robust cash flow projection software should allow for seamless, real-time scenario testing without breaking the underlying model. In Quadratic, the user could easily tweak variables to test different outcomes.
By injecting a proposed loan into the inflows, the user could watch the cumulative balance update instantly on their visual dashboard. This real-time feedback loop makes it incredibly simple to calculate a new break-even point and determine exactly how much financing is required to bridge the gap caused by delayed collections.
Conclusion: Streamline your project's financial future
Building a reliable financial model does not have to be a painful process of manual data entry and broken formulas. By fixing text-to-number errors at the source, structuring a multi-year 90-day delay model, visualizing the cumulative balance, and testing loan scenarios, you can gain total control over your project planning.
You no longer need to jump between a static cash flow projections template for data entry and an expensive enterprise tool for visualization. Quadratic unifies this entire workflow into a single, intelligent workspace, positioning it among the best data science tools.
We encourage you to try Quadratic to build your next cash flow projection. Experience how bringing your data, logic, and visualizations into one AI-powered spreadsheet, leveraging top AI tools for finance, ensures your financial planning remains accurate, visually compelling, and entirely error-free.
Use Quadratic to build robust cash flow projections for project planning
- Clean data instantly: Quickly fix frustrating text-to-number errors in messy data exports using Quadratic’s built-in AI flows and native Python, ensuring accurate baseline numbers for your forecasts.
- Model complex scenarios: Build flexible, multi-year cash flow models, including specific logic like 90-day collection delays, using Python, SQL, and formulas in one grid without creating fragile cell references.
- Visualize financial health: Create time-series charts directly in your spreadsheet to track inflows, outflows, and cumulative cash, instantly spotting potential deficits months in advance.
- Run dynamic what-if analyses: Test various loan financing options and other financial scenarios, seeing real-time updates to your cash balance and break-even points, all in one place.
- Unify your workflow: Move from raw data cleaning to advanced modeling, visualization, and scenario planning within a single, collaborative AI spreadsheet, eliminating the need for multiple tools.
Ready to take control of your project's financial future? Try Quadratic.