
Table of contents
- Step 1: Building a foundation with market research and entry strategy
- Step 2: Calculating unit economics and go-to-market (GTM) fit
- Step 3: Dynamic CPG financial modeling and scenario planning
- Step 4: Visualizing data for investors (the pitch deck view)
- Stop fragmenting your launch strategy
- Use Quadratic for consumer goods market research
Launching a new brand in the consumer packaged goods space requires much more than just a great product, especially considering that most product launches fail to cross the threshold of highly successful first-year sales. To succeed and secure capital, founders must prove product-market fit and demonstrate clear, defensible unit economics to potential investors.
Traditionally, this process suffers from a massive fragmentation gap where founders and financial analysts are forced to juggle separate tools for demographic research, download static spreadsheet templates for fp&a modeling, and rely on isolated calculators to figure out unit economics. This disjointed approach slows down decision making and leaves room for costly errors.
There is a better way to handle consumer goods market research. Recently, an early-stage CPG company preparing for its initial launch and funding round transformed its approach by adopting a unified workflow. By bringing their market data, dynamic scenario planning, and investor-ready pitch deck views onto a single canvas in Quadratic, they replaced disjointed, static spreadsheets with an interconnected, live data environment. Here is how they built a comprehensive launch strategy and financial model from the ground up.
Step 1: Building a foundation with market research and entry strategy
Every successful product launch begins with a deep understanding of the landscape. Before committing capital to manufacturing or marketing, founders must size the market, map out the competitive landscape, and analyze customer demographic divides alongside early product feedback. Evaluating product performance metrics and broader economic indicators is essential to validate initial product-market fit.
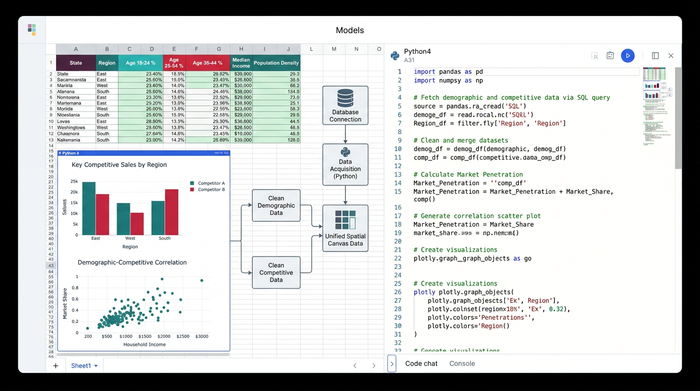
For the early-stage CPG company in our use case, gathering consumer packaged goods market research meant dealing with massive, diverse datasets. Instead of isolating this information across multiple browser tabs and disconnected files, the team pulled their data directly into Quadratic. Using built-in database connections and native Python integrations, they imported demographic statistics, competitor pricing models, and economic indicators straight onto an infinite canvas.
This spatial approach to market research consumer goods completely changed their workflow. The team could map out the competitive landscape right next to demographic feedback, allowing them to spot trends visually. Because everything lived in one unified workspace, they could clearly see how macroeconomic indicators might impact their target audience without having to constantly switch between different research tools.
Step 2: Calculating unit economics and go-to-market (GTM) fit
Once the foundational research is established, the focus must shift to granular economics. Investors want to see a clear bridge between product-market fit and a profitable go-to-market strategy, frequently evaluating gross margin as a guardrail against over-investing in marketing before unit economics are proven. This requires a precise understanding of CPG unit economics, including Customer Acquisition Cost, Lifetime Value, and the specific costs tied to manufacturing and inventory.
A critical part of this transition involves regional GTM strategies. The CPG company needed to assess cost advantages, evaluate potential ROI from regional tax incentives, and create targeted launch plans for specific metropolitan areas. Broad CPG market research directly informs these local strategies, helping founders decide exactly where to deploy their initial marketing budgets.
Inside Quadratic, the team built dynamic unit economic formulas that connected directly to their regional research. By having all their data in one place, they could seamlessly link regional incentive data with metropolitan launch costs. If they wanted to see the financial difference between launching in Austin versus Chicago, they simply updated a variable. The spreadsheet instantly calculated how local shipping costs and regional incentives would impact their bottom line, providing a clear view of their most profitable GTM fit.
Step 3: Dynamic CPG financial modeling and scenario planning
The core of any launch and funding strategy is a robust startup financial model. Founders must set up various growth scenarios, comparing best case versus worst case outcomes, and plan for production scaling across different channels like direct-to-consumer and traditional retail.
Many founders rely on a generic financial forecast template to build these models. Unfortunately, these static files break easily when modified and severely limit multi-variable planning. When data is hardcoded, testing a new supply chain assumption often means rebuilding the entire spreadsheet.
By leveraging Quadratic to build a dynamic 3 statement financial model, the CPG team avoided the pitfalls of static templates. Because their market data, unit economics, and regional launch plans were all located on the same canvas, their financial model was entirely dynamic. Changing a single variable, such as a localized supply chain cost or a revised customer acquisition estimate, automatically updated the entire p&l forecast. They could use native SQL to query their own historical data and formulas to project future growth, allowing them to test multiple scaling scenarios without ever breaking the underlying model.
Step 4: Visualizing data for investors (the pitch deck view)
The ultimate goal of comprehensive research and modeling is to secure funding. Raw data and complex formulas are not enough on their own. The information must be synthesized into a compelling narrative for investors; following proven investor pitch deck guidelines ensures founders highlight key metrics like household penetration, retail velocity, and unit growth.
Quadratic excels at turning deep analysis into presentation-ready assets. After building their extensive model, the CPG team used the infinite canvas to consolidate their complex data into a clean, focused executive summary. They organized their workspace so that the raw data and Python scripts lived in one area, while the high-level charts and financial summaries lived in another.
By framing specific views of their financial model and unit economics, the team created live, interactive assets for their pitch deck. Instead of pasting static screenshots into a presentation, they could show investors exactly how their business would perform under different conditions, adjusting variables live during the pitch to answer investor questions with absolute confidence.
Stop fragmenting your launch strategy
From the initial stages of demographic research to the final investor pitch, successful product launches require connected data. Relying on isolated calculators, disjointed research documents, and rigid financial templates only creates friction and obscures valuable insights.
By bringing your consumer goods market research, unit economics, dynamic financial modeling, and investor summaries into one unified workspace, you can make better business decisions faster. Stop relying on static templates that limit your strategic vision. Start building your own unified CPG market research and financial model in Quadratic today, and raise your next round of capital with complete confidence.
Use Quadratic for consumer goods market research
- Connect all your research in one workspace: Pull demographic statistics, competitor pricing, and macroeconomic indicators directly onto an infinite canvas using native SQL and Python integrations.
- Link unit economics to regional strategies: Connect metropolitan launch costs, regional tax incentives, and shipping variables directly to your financial formulas to instantly compare profitability across target markets.
- Build flexible, unbroken financial models: Create dynamic 3-statement models that allow you to test multiple scaling scenarios across direct-to-consumer and traditional retail channels without the risk of broken formulas.
- Present live, interactive data to investors: Design presentation-ready summaries on the canvas that let you adjust variables on the fly to answer investor questions with absolute confidence during your pitch.
Ready to streamline your launch strategy and build investor-ready models on a single canvas? Try Quadratic