Table of contents
- What makes medical claims data difficult to process
- ICD-10 vs. CPT codes: why the distinction matters
- The practical workflow: cleaning and mapping CPT claims data in Quadratic
- Why this workflow matters for medical billing professionals
- Beyond CPT cleanup: applying this approach to other medical data processing tasks
- Conclusion
- Use Quadratic to do medical data processing
If you have ever opened a raw claims export and stared down a column full of five-digit codes with no labels, no context, and no obvious way to tell a procedure from a diagnosis, you already know the problem this article solves. Claims data rarely arrives ready for analysis. It shows up as a mix of ICD-10 diagnostic codes and CPT procedural codes, jammed into the same columns, with identifiers that mean everything to a billing system and nothing to a human trying to read a report.
This is medical data processing in its most practical form: taking messy, code-heavy transaction data and turning it into something a billing team, an auditor, or a finance lead can actually use. In this article, we will walk through exactly that. We will briefly cover the ICD versus CPT distinction, since understanding it is necessary background, and then spend most of our time on the part that actually matters: a step-by-step workflow for mapping CPT codes to readable descriptions and filtering out ICD-10 noise, done inside Quadratic on a real claims dataset. This is not a theory piece. It is an execution guide.
What makes medical claims data difficult to process
Anyone who has pulled a claims or transaction file straight from a billing system and attempted to clean messy spreadsheet data knows the shape of the problem. Rows are packed with code values, but the columns rarely explain what those codes mean. A single transaction might carry a CPT code describing the procedure performed, an ICD-10 code describing the diagnosis behind it, a provider identifier, a date, and a dollar amount, all sitting side by side with no labels attached.
This matters for back-office billing operations because most downstream work depends on being able to read the data quickly. Medical electronic data processing tasks like reconciliation, reporting, or claims review all assume someone can look at a row and understand what happened. When codes are unlabeled and mixed together, that assumption breaks down. Analysts end up cross-referencing code books manually, or worse, making assumptions about what a code means based on context clues.
Two problems tend to stack on top of each other here. First, procedure codes lack any human-readable context, so nobody outside of a certified coder can interpret them at a glance. Second, diagnostic codes are mixed in with procedural ones, adding noise to any analysis that is actually trying to answer a procedure-focused question. Solving both is the goal of the workflow ahead.
ICD-10 vs. CPT codes: why the distinction matters
Before cleaning anything, it helps to be clear on what these two code sets actually represent.
ICD-10 codes are diagnostic codes. They answer the "why" of a claim: what condition, injury, or health issue is being treated. CPT codes are procedural codes, which are detailed in the American Medical Association's CPT code set overview to standardize medical services and procedures. They answer the "what": the specific service, test, or procedure a provider performed.
Both are necessary for a complete claim, but they answer different questions, and that becomes a problem the moment you are trying to analyze billing volume, reimbursement patterns, or procedure trends. If ICD-10 codes and their descriptions stay mixed into a procedure-centric report, they add rows and text that have nothing to do with what was actually performed. The result is a dataset that looks complete but is harder to read, harder to trust, and harder to use for compliant data processing in a medical billing context, where adhering to HIPAA Administrative Simplification standards and ensuring accuracy in how each code set is handled is not optional.
Understanding the difference between ICD-10 and CPT is step one. Most guides stop there. The real work, and the part that actually determines whether your claims data is usable, is separating and cleaning it. Here is how to finish that job.
The practical workflow: cleaning and mapping CPT claims data in Quadratic
This is the core of the process: a straightforward sequence for turning a raw claims export into an enriched, procedure-only dataset. The workflow below mirrors how a billing professional actually worked through this task inside Quadratic, moving from a messy import to a clean, readable result.
Step 1: importing raw claims transaction data
The starting point is a structured medical transaction dataset, the kind that comes straight out of a billing system or clearinghouse export. It typically includes a mix of CPT codes, ICD-10 codes, transaction identifiers, dates, and amounts, all sitting in the same table with no descriptive text attached to any of the codes.
Loading this into Quadratic's spreadsheet-driven workspace is the first move. Because Quadratic works like a familiar spreadsheet grid while also supporting direct data connections and Python underneath, the raw file drops in without any reformatting gymnastics. At this stage, much like dealing with messy Excel data, the data is intact but still unreadable in any practical sense: rows of codes, no labels, no way to tell at a glance what any given transaction actually represents.
Step 2: appending human-readable CPT descriptions via a reference legend
The next step is where the data starts to become useful. A CPT reference legend, essentially a lookup table pairing each CPT code with its plain-language description, gets mapped against the claims data so every procedure code picks up a readable label.
This is medical data processing and analysis doing its actual job: turning an opaque five-digit code into something like "Office visit, established patient" instead of leaving it as a code only a certified coder could decode. In Quadratic, this mapping happens directly in the grid, whether through a formula-based lookup, a quick Python join similar to using pandas for Excel, or an AI-assisted prompt that handles the matching logic. The billing professional does not need to manually cross-reference a CPT code book row by row.
The value here is immediate. What was a column of numbers is now a column of descriptions that anyone on a billing or finance team can read without specialized coding knowledge. This is exactly the kind of back-office task that used to require either a dedicated coder or a slow manual lookup process, and it now happens in a single mapping step.
Step 3: filtering out ICD-10 codes for a procedure-centric view
With CPT descriptions in place, the next task is removing what does not belong in a procedure-focused view: the ICD-10 diagnostic codes and their associated descriptions. This is the direct payoff of the ICD versus CPT distinction covered earlier. Diagnostic codes answer a different question than the one this dataset is now built to answer, so they get filtered out entirely.
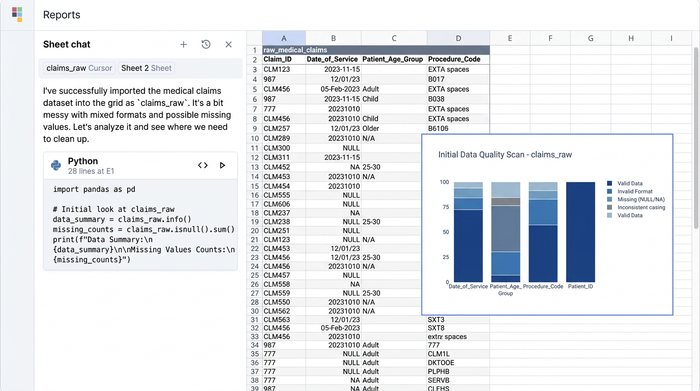
In practice, this means isolating rows or columns tied to diagnosis codes and removing them from the working view, leaving a dataset built exclusively around procedures. Quadratic makes this filtering straightforward, whether by writing a quick filter condition as an alternative to an autofilter and advanced filter in Excel, using AI to identify and strip ICD-10 patterns, or applying a formula that isolates CPT-only rows. The result is a dataset that no longer forces the reader to mentally sort "why" from "what" on every row.
Step 4: reviewing the cleaned, enriched dataset
What started as a jumble of unlabeled codes is now a clean, enriched, procedure-centric table. Every CPT code carries a readable description. Every ICD-10 code and its description are gone. What remains is a dataset built specifically to support procedure-based reporting, reimbursement analysis, or reconciliation work.
The practical value of this end state is easy to see. Review takes less time because nobody has to pause and look up a code. Reporting is clearer because the dataset only contains what the report actually needs. And whoever consumes this data next, whether a billing manager, an auditor, or an analyst, is working with something legible instead of something that requires a decoder ring.
Why this workflow matters for medical billing professionals
This kind of map-and-filter workflow shows up constantly in medical billing operations, and the value of doing it well compounds quickly. Fewer manual lookups mean fewer transcription errors, which is critical since billing and coding discrepancies are a primary driver of costly insurance claim denials. A clean, labeled dataset means faster claims review and less back-and-forth when someone downstream has a question about a specific transaction. A clear audit trail, where procedure codes are labeled and diagnostic noise has been removed, makes reporting and reconciliation noticeably less ambiguous.
This is squarely the kind of task a medical data processing officer or billing analyst handles on a recurring basis, not as a one-off project but as part of routine claims operations. Doing it in a flexible spreadsheet environment rather than a rigid legacy system, or worse, a manual code-lookup process, saves real time on tasks that otherwise eat into a billing team's week.
There is also a quieter benefit here worth naming: accuracy. Compliant data processing in the medical industry depends on handling code sets correctly and consistently. Following data transformation best practices, a repeatable workflow that maps CPT codes accurately and separates them cleanly from ICD-10 data reduces the chance of misclassification creeping into reports or reimbursement analysis. Clean data is not just easier to read, it is also easier to trust.
Beyond CPT cleanup: applying this approach to other medical data processing tasks
The map-and-filter pattern used here is not limited to CPT and ICD-10 codes. The same approach, appending readable context via a reference table, then filtering out what does not belong, applies to plenty of other back-office healthcare data tasks. Mapping HCPCS codes using official CMS lists, cleaning eligibility files, standardizing provider identifiers across systems, or reconciling payer-specific code variants all follow a similar logic.
For readers who need to stay current on the underlying code sets themselves, CMS and the AMA maintain the official CPT and ICD-10 references and update them periodically. Keeping an eye on those updates is worth doing, but it is a separate task from the cleaning workflow itself.
Conclusion
Raw claims data starts as a mix of unlabeled codes with no context and no clear structure. After running it through a mapping and filtering workflow, it becomes something else entirely: a clean, enriched, procedure-centric dataset that is ready for actual analysis.
That transformation is the real substance of medical data processing. It does not have to mean choosing between a basic glossary of code definitions and an abstract discussion of enterprise data normalization. It can be a concrete, repeatable process that a billing professional runs whenever a new claims file lands on their desk.
If you are working with your own claims data and want to try this mapping and filtering approach directly, Quadratic gives you the spreadsheet familiarity to get started immediately, along with the AI and code support to handle the messier parts of the job when you need it.
Use Quadratic to do medical data processing
- Connect directly to live billing databases and clearinghouse exports to pull raw claims data without manual CSV downloads.
- Use native Python and pandas to join CPT reference legends and map code descriptions instantly across thousands of rows.
- Apply AI-assisted formulas and filters to strip out ICD-10 diagnostic noise and isolate procedure-only views in seconds.
- Work securely with HIPAA-compliant infrastructure, optional self-hosting, and zero-day data retention for sensitive patient information.
- Collaborate in real time with billing managers and finance teams on a single, shared canvas to speed up audits and reconciliation.
Ready to simplify your billing workflows and clean claims data faster? Try Quadratic
